|
|
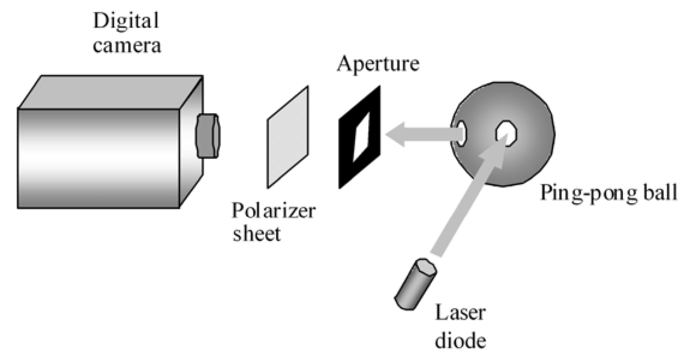
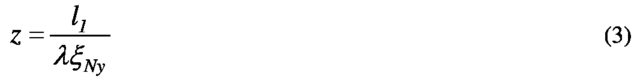
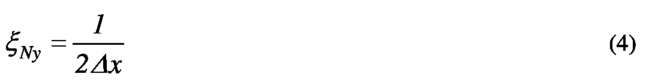
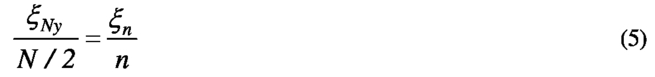
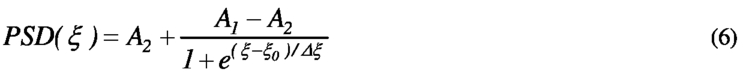
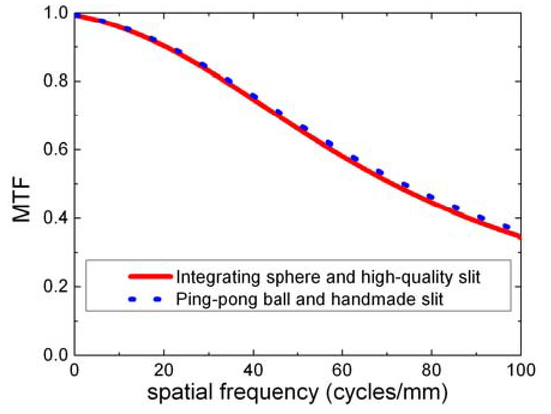
1.INTRODUCTIONThe rapid development of semiconductor technology has facilitated the generalized use of devices to capture images based on matrices of semiconductor detectors, such as CCDs (charge-coupled devices)1 and CMOS (Complementary Metal-Oxide Semiconductor).2 Digital cameras are widely used in diverse fields of science and technology as a powerful tool with which to gather information from complex scenes. Examples include quality control in various industrial applications, measurement of the colors of objects, astrophysics, illumination (for characterizing the spatial distribution of light), and artificial vision. The determination of the modulation transfer function (MTF) enables the evaluation of image quality of a system by its spatial-frequency response.3, 4 For measuring the MTF of solid-state cameras, the literature cites different methods that differ essentially in the type of target or pattern used as the object. Thus, for example, methods use bar targets,5 random targets,6, 7 canted self-imaging targets,8 and interferometric fringes.9, 10 One of the methods to measure the MTF, established in our laboratory, is based on using a laser-speckle pattern as the object.11-16 This method is suitable for analyzing the detector independently of the camera lens, given that it does not require a lens to project the pattern. Furthermore, the entire array is tested and the alignment of the system is not critical, since the speckle is positioned randomly in the array of pixels of the image detector. Speckle is an interference phenomenon that occurs when coherent radiation is scattered from a rough surface. Several techniques can be used to generate the speckle pattern, such as different types of transmissive diffusers (ground glass,11 fused silica,12 microlens arrays13) or integrating spheres.14-16 In the latter case, an aperture situated in front of the integrating sphere enables us to specify the spatial-frequency content of the speckle pattern. Two of the apertures used to date are the single-slit14 and double-slit,15 both of which present advantages and drawbacks.16 In this work, we have used a single slit. The aim of this work is to present and experimentally validate a low-cost experimental setup to evaluate the image quality of digital-camera sensors by the MTF, which can be implemented in undergraduate and postgraduate teaching. For this, we used a ping-pong ball as a diffuser to generate speckle patterns, and a slit made in a piece of black cardboard to specify the spatial-frequency content of the speckle pattern. Finally, the results were compared with those found using an integrating sphere and a high-quality steel slit, showing a similar MTF in both cases. 2.THEORETICAL BACKGROUNDThe relationship between the theoretic power-spectral density known for a single slit (PSDinput) and the measured power-spectral density (PSDoutput) allows us to determine the MTF of the image sensor by means of the expression14 where ξ and η are the spatial frequencies corresponding to the horizontal and vertical directions x and y, respectively. PSDoutput is determined from the speckle pattern captured with the image sensor, being proportional to the squared magnitude of the Fourier transform of this speckle pattern. In the case of a rectangular single slit, PSDinput is given by17, 18 where tri(X) = 1 − |X| for |X| ≤ 1 and zero elsewhere, 〈I〉2 is the square of the average speckle irradiance of the speckle pattern, δ(ξ,η) is a delta function, l1 and l2 are, respectively, horizontal and vertical dimensions of the single slit, λ is the wavelength of the laser, and z is the distance between the aperture and image sensor. Given the geometry of the aperture used, PSDinput can be separated into frequencies ξ and η. In the present work, we consider PSDinput(ξ) and therefore we have determined the horizontal MTF. This can be done in a similar way for the vertical direction to calculate the vertical MTF. 3.METHOD3.1Experimental setupFigure 1 presents the experimental device used, composed of a laser diode (λ = 635 nm; 3mW), a diffuser to generate the speckle pattern, an aperture to specify the spatial-frequency content of the speckle pattern, a polarizer sheet to provide a linearly polarized speckle pattern, and finally the camera under study connected to a control card installed in a personal computer. For the MTF measurement, we used a ping-pong ball as a diffuser, with two handmade circular apertures which acted as input and output ports, respectively. Also, we measured the MTF of the image sensor using an integrating sphere (2 in. inner diameter) to compare the results. For an aperture, we made a rectangular single-slit (3 mm wide and 6 mm high) in a piece of black cardboard. In Section 4 the results are compared with those found using a high-quality steel slit. The laser radiation is aimed at the input port of the ping-pong ball, generating the speckle pattern at the output port. The aperture situated at the output port of the ping-pong ball determines the content in spatial frequency of the pattern registered in the detector. Under these conditions, the linear polarizer ensures that the PSDinput is given by Eq. (2). With the single slit, the MTF can be determined from a single measurement without the need to move the camera, but it must be situated at a distance from the aperture in such a way that the maximum input spatial frequency is equal to the Nyquist frequency of the image sensor.12, 14 In this way, the MTF can be determined over the largest possible frequency range, and thus aliasing is avoided. The distance z between the detector and the single-slit aperture can be calculated by the expression where l1 is the slit width, λ is the wavelength of the laser, and ξNy is the Nyquist spatial frequency of the image sensor in the horizontal direction. For a detector array with a centre-to-centre spacing between the photoelements, Δx, the Nyquist frequency is given by The camera used was a 12-bit monochrome Atmos Areascan 1M30, with a CMOS sensor which had 1312(H)x1024 (V) pixels. In this case the sensor pixel-pitch was 5 μm in the horizontal as well as in the vertical direction, corresponding to a Nyquist frequency of 100 cycles/mm given by Eq. (4). Taking into account the width of the single slit and the Nyquist frequency, we can calculate the distance z between the sensor and the aperture by using Eq. (3). In our case, this distance was z=47 mm. 3.2Data processingOnce the detector was set at the corresponding distance from the single-slit aperture, as indicated in Section 3.1, the PSDoutput(ξ) was determined in the following way. For a given digitized frame of speckle data (Figure 2), each horizontal row of data is a single observation of an ergodic random process. A fast Fourier transform (FFT), which is a discrete Fourier transform, was performed on each row of speckle data. The magnitude squared in one dimension provided a single estimate of the one-dimensional power spectrum, PSDoutput(ξ). These spectra were averaged, for a better signal-to-noise ratio in the PSDoutput(ξ).19 To reduce the noise even further, the average was taken for 10 frames. The frames were stored in tiff format without compression. Figure 2.Speckle pattern photographed with the CMOS camera using the high-quality slit together with the ping-pong ball as a diffuser. 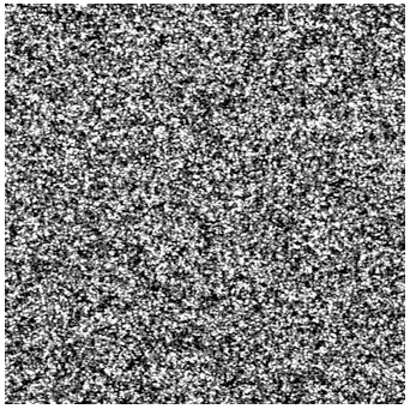 When a FFT is performed on a dataset of length N, the Nyquist frequency appears at the N/2 component of the FFT output. A ratio can be formed to evaluate the spatial frequency ξn that corresponds to the nth component as16 Equation (5) associates frequencies between zero and the Nyquist frequency with FFT components from 0 to the N/2 component. In this work, we used N=1024, and therefore the total number of spatial frequencies within the range from 0 to the Nyquist frequency of the detector was 512. Before processing, each digitized frame of speckle data was corrected in order to reduce effects due to the spatial noise of the sensor itself. With respect to the spatial noise of an image sensor, a distinction can be made between the fixed-pattern noise (FPN) and the photoresponse non-uniformity (PRNU). The FPN refers to the pixel-to-pixel variation that occurs when the array is in the dark, and thus it is signal-independent noise. The PRNU is due to the difference in response of each pixel to a given uniform signal and therefore is signal-dependent noise. The FPN was corrected by subtracting from the speckle image the dark image captured by obscuring the detector and the PRNU, by means of the procedure proposed elsewhere.11 For the image processing, the necessary software was developed using MATLAB. 4.RESULTS AND DISCUSSIONFigure 3 shows the output PSD fit and the output PSD values calculated from the speckle pattern shown in Fig. 2. Figure 3.Output PSD values and fit for the CMOS image-sensor calculated from the speckle pattern shown in Fig. 2. 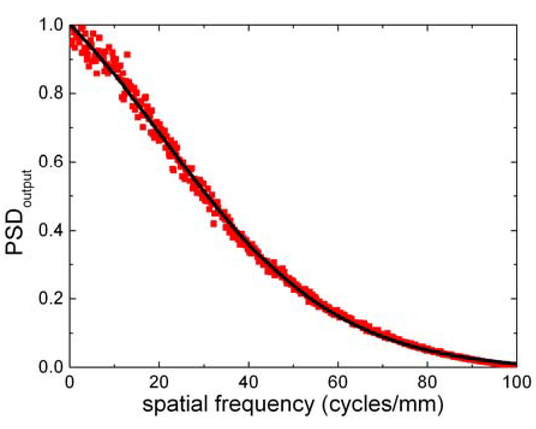 The PSDoutput experimental values were fitted to the following function: where A1, A2, ξ0, and Δξ coefficients are provided by the fit. In the case of Figure 3, the fit regression coefficient, R2, was 0.9969. In a similar way the PSD fits were calculated for the other cases. Figure 4 compares the MTF of the CMOS image-sensor using the integrating sphere and the ping-pong ball. Figure 4.MTF of the CMOS image-sensor using the integrating sphere and the ping-pong ball. In both cases the high-quality steel slit was used as an aperture. 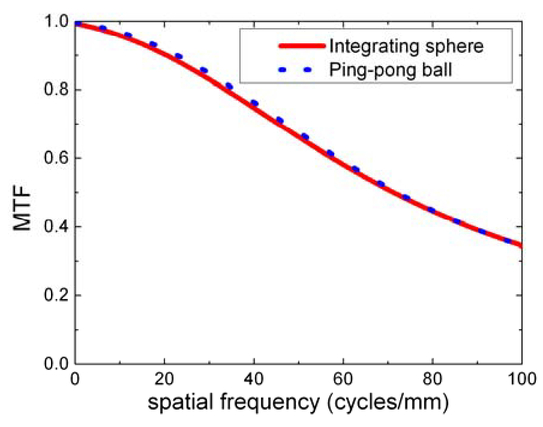 In the two cases shown in Fig. 4, the high-quality steel slit was used as an aperture. The MTF measured with the ping-pong ball was similar to that determined with the integrating sphere, considering the uncertainty of the method.20 To investigate the influence of the slit on the MTF, we cut a slit into a sheet of black cardboard. Figure 5 compares the results achieved with the high-quality steel slit and with the handmade cardboard slit, showing similar MTF values. In both cases, the integrating sphere was used as a diffuser. Figure 5.MTF of the CMOS image-sensor using the high-quality steel slit and the handmade cardboard slit. In both cases the integrating sphere was used as a diffuser.  Finally, the MTF of the digital-camera sensor was calculated using the ping-pong ball and the handmade slit, and then was calculated using the integrating sphere and the high-quality steel slit. The results achieved with both experimental setups were compared, showing a similar MTF in both cases (Figure 6). 5.CONCLUSIONSIn this work, we have presented a low-cost experimental setup to evaluate the image quality of digital-camera sensors, which can be implemented in undergraduate and postgraduate teaching. The method consists of evaluating the modulation transfer function (MTF) of digital-camera sensors by speckle patterns using a ping-pong ball as a diffuser and a handmade slit in a sheet of black cardboard; the slit situated in front of the output port of the ping-pong ball determines the content in spatial frequency of the speckle pattern photographed by the digital camera. The experimental setup is composed of the digital camera under study, a laser diode, a polarizer sheet, the handmade slit, and the ping-pong ball with two handmade circular apertures which act as an input and output ports, respectively. The MTF of a digital-camera sensor was calculated using the ping-pong ball and the handmade slit, and then the MTF was calculated using an integrating sphere and a high-quality steel slit. The results achieved with both experimental setups were compared, showing a similar MTF in both cases. ACKNOWLEDGEMENTSThe authors express their appreciation to the Ministerio de Ciencia e Innovación for financing project FIS2011-25724 and David Nesbitt for correcting the English text. REFERENCESHolst, G. C.,
“CCD Arrays, Cameras, and Displays,”
SPIE Optical Engineering Press, Bellingham, Washington
(1996). Google Scholar
Yadid-Pecht, O. and Etienne-Cummings, R.,
“CMOS Imagers: From Phototransduction to Image Processing,”
Kluwer Academic Publishers, Boston
(2004). https://doi.org/10.1007/b117398 Google Scholar
Feltz, J. C. and Karim, M. A.,
“Modulation transfer function of charge-coupled devices,”
Appl. Opt., 29
(5), 717
–722
(1990). https://doi.org/10.1364/AO.29.000717 Google Scholar
Park, S. K., Schowengerdt, R. and Kaczynski, M-A.,
“Modulation transfer-function analysis for sampled image systems,”
Appl. Opt., 23
(15), 2572
–2582
(1984). https://doi.org/10.1364/AO.23.002572 Google Scholar
Sitter, D. N. Jr., Goddard, J. S. and Ferrell, R. K.,
“Method for the measurement of the modulation transfer function of sampled imaging systems from bar-target patterns,”
Appl. Opt., 34
(4), 746
–751
(1995). https://doi.org/10.1364/AO.34.000746 Google Scholar
Daniels, A., Boreman, G. D., Ducharme, A. D. and Sapir, E.,
“Random transparency targets for modulation transfer function measurement in the visible and infrared regions,”
Opt. Eng., 34
(3), 860
–868
(1995). https://doi.org/10.1117/12.190433 Google Scholar
Backman, S. M., Makynen, A. J., Kolehmainen, T. T. and Ojala, K. M.,
“Random target method for fast MTF inspection,”
Opt. Express, 12
(12), 2610
–2615
(2004). https://doi.org/10.1364/OPEX.12.002610 Google Scholar
Guérineau, N., Primot, J, Tauvy, M. and Caes, M.,
“Modulation transfer function measurement of an infrared focal plane array by use of the self-imaging property of a canted periodic target,”
Appl. Opt., 38
(4), 631
–637
(1999). https://doi.org/10.1364/AO.38.000631 Google Scholar
Marchywka, M. and Socker, D. G.,
“Modulation transfer function measurement techniques for small-pixel detectors,”
Appl. Opt., 31
(34), 7198
–7213
(1992). https://doi.org/10.1364/AO.31.007198 Google Scholar
Greivenkamp, J. E. and Lowman, A. E.,
“Modulation transfer function measurements of sparse-array sensors using a self-calibrating fringe pattern,”
Appl. Opt., 33
(22), 5029
–5036
(1994). https://doi.org/10.1364/AO.33.005029 Google Scholar
Pozo, A. M., Ferrero, A., Rubiño, M., Campos, J. and Pons, A.,
“Improvements for determining the modulation transfer function of charge-coupled devices by the speckle method,”
Opt. Express, 14
(13), 5928
–5936
(2006). https://doi.org/10.1364/OE.14.005928 Google Scholar
Boreman, G. D. and Dereniak, E. L.,
“Method for measuring modulation transfer function of charge-coupled devices using laser speckle,”
Opt. Eng., 25
(1)), 148
–150
(1986). Google Scholar
Ducharme, A. D.,
“Microlens diffusers for efficient laser speckle generation,”
Opt. Express, 15
(22), 14573
–14579
(2007). https://doi.org/10.1364/OE.15.014573 Google Scholar
Boreman, G. D., Sun, Y. and James, A. B.,
“Generation of laser speckle with an integrating sphere,”
Opt. Eng., 29
(4), 339
–342
(1990). https://doi.org/10.1117/12.55601 Google Scholar
Sensiper, M., Boreman, G. D., Ducharme, A. D. and Snyder, D. R.,
“Modulation transfer function testing of detector arrays using narrowband laser speckle,”
Opt. Eng., 32
(2), 395
–400
(1993). https://doi.org/10.1117/12.60851 Google Scholar
Pozo, A. M. and Rubiño, M.,
“Comparative analysis of techniques for measuring the modulation transfer functions of charge-coupled devices based on the generation of laser speckle,”
Appl. Opt., 44
(9), 1543
–1547
(2005). https://doi.org/10.1364/AO.44.001543 Google Scholar
Goodman, J. W.,
“Statistical properties of laser speckle and related phenomena,”
Laser Speckle and Related Phenomena, 9 Springer-Verlag, Berlin
(1984). Google Scholar
Goldfischer, L. I.,
“Autocorrelation function and power spectral density of laser-produced speckle patterns,”
J. Opt. Soc. Am., 55
(3), 247
–253
(1965). https://doi.org/10.1364/JOSA.55.000247 Google Scholar
Boreman, G. D.,
“Fourier spectrum techniques for characterization of spatial noise in imaging arrays,”
Opt. Eng., 26
(10), 985
–991
(1987). https://doi.org/10.1117/12.7974185 Google Scholar
Fernández-Oliveras, A., Pozo, A. M. and Rubiño, M.,
“Speckle-Based Modulation Transfer Function Measurements for Comparative Evaluation of CCD and CMOS Detector Arrays,”
Optical Review, 20
(1), 41
–49
(2013). https://doi.org/10.1007/s10043-013-0008-3 Google Scholar
|