|
|
1.INTRODUCTIONMeteorological data are extensively used in research purposes in different sectors including agriculture and economy. For instance, they can be used for crop yield and hydrological monitoring and forecasting, for the assessment of economic impacts of climate change and to assess the impacts of extreme weather events. After the 2008 crisis1,2, food security has become one of the highest priorities in the European Commission. European Union policies aim at ensuring the European Union independence from price volatility. In the Joint Research Centre (JRC), the Monitoring Agricultural Resources Unit (MARS) serves the agriculture and food policies of the European Union, their impact on rural economies and on the environment, encompassing the global issues of food security and climate change. A large set of expertise includes crop modeling, agro-meteorology, sampling methods, environmental geo-spatial analysis, econometrics through European and global data infrastructures. Based on this skill-set, JRC generates evidence-based information and forecasts for the management of agricultural practices and early warnings on Food Security. In this framework, the Crop Growth Monitoring System (CGMS) has been developed. It encompasses remote sensing, meteorological observations, agro-meteorological modelling, and statistical analysis. The results of the crop growth monitoring activities are synthesized in the ‘MARS Bulletin – Crop Monitoring in Europe’3, a monthly report published since 1975. The Crop Growth Monitoring System (CGMS) provides reliable and timely spatial information about crop status in Europe. The CGMS includes three components:
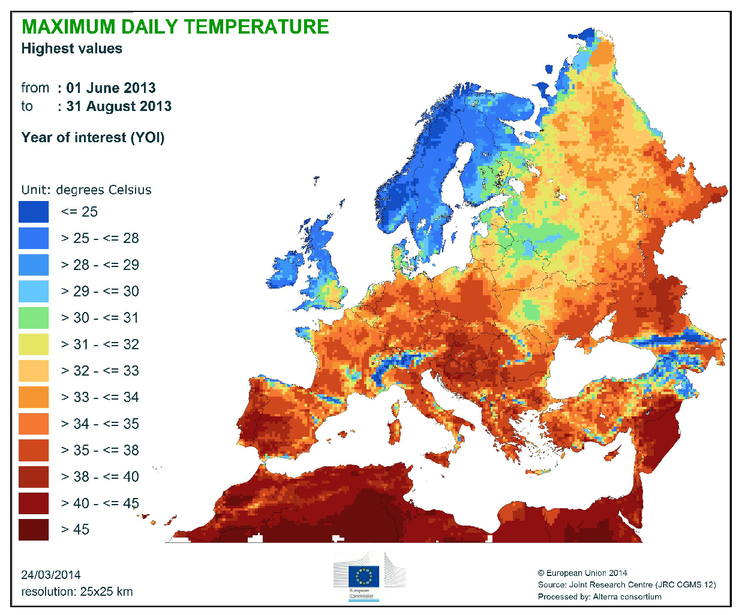
The objective of this paper is to present the meteorological datasets developed and maintained by the MARS Unit to evaluate its use through a survey, to enhance its distribution, visibility and usability. 2.DATAAt European level, the Crop Growth Monitoring System (CGMS) manages the meteorological, crop yield and crop area data since 1975. The spatial coverage includes EU Member States, neighboring European countries, candidate countries and the Mediterranean countries (North Africa). More specifically, the meteorological data have been collected from a network of around 5.000 meteorological weather stations throughout Europe. The original station (point) data are interpolated to produce raster maps with a resolution of 25km x 25km grid cell. The raster datasets are also aggregated to different administrative levels (Countries, regions, provinces), such as NUTS4, Nomenclature of territorial units for statistics. The CGMS includes the following meteorological attributes at 25km x 25km grid cells:
Other derived meteorological variables can be extracted from CGMS, such as daily evaporation and evapotranspiration. The daily evapotranspiration is calculated on the Penman-Monteith method5 and represents daily sum of evaporation and plant transpiration. 3.DISSEMINATION OF INTERPOLATED METEOROLOGICAL DATA3.1Data distribution policyIn December 2011 the European Commission adopted a revised Decision6 on the re-use of Commission documents. The decision on the re-use of European Commission documents has ‘the aim of facilitating a wider reuse of information, enhancing the image of openness of the European Commission, and avoiding unnecessary administrative burdens for reusers and the Commission services alike’. Nevertheless, it is not allowed the re-use of information protected by third party intellectual property rights, and/or received by other institutions (e.g., national weather services). 3.2Agri4cast Resources DATAPORTALThe dissemination of the interpolated meteorological datasets is performed through the Agri4cast Resources Portal, at the webpage http://agri4cast.jrc.ec.europa.eu/dataportal/. Through a direct online registration procedure, interpolated meteorological datasets are freely available to the public. They can be used, for instance, for scientific analyses, provided that meteorological data are duly acknowledged and cited. However, the interpolated meteorological datasets cannot be redistributed to third parties and cannot be used for commercial activities. 3.3Restricted data disseminationThe Agri4cast Resources Data-portal adopts an open access policy to all public resources. A further authorization request, though online, will be limited to restricted resources such as the heating and cooling degree days. 3.4Data downloadsSince 2011, 542 users asked to register to data portal; among them, around 27% felt discouraged in continuing with a data request. The 73% of the users who downloaded meteorological datasets have done around 3,000 requests. Each data request includes a combination of a meteorological attribute, period (1975-2013) and geographical coverage (around 50 countries). The combination of those three options results in more than 14,000 datasets available for distribution. The users have downloaded more than 550,000 datasets. The most requested parameters are maximum/minimum temperature and precipitation representing together the 43% of the total requests. Whereas, snow depth is the least requested parameter, having the 5% of the total requests. The datasets have a temporal coverage of 39 years (1975-2013), and the year with the maximum number of requests is 2003 (extreme hot summer). Comparing the decades, it have been noticed that users have almost equal preference to each of the covered decade, with slight preference for data in the period 1991-2000. Regarding geographical coverage, users downloaded data for the five bigger European countries: France, Germany, Italy, Spain and United Kingdom. The temperature dataset covering France in 2003 was the most requested. 4.USER EVALUATION SURVEY4.1Survey purpose and structureA questionnaire on Interpolated Meteorological Data was distributed to the user community, so as to assess the actual use and usefulness of the meteorological data, the audience reached, the visibility and the concrete worth of the service. The survey was made of six focused closed-ended questions and one open-ended question to let the user community express freely their contribution and to allow a meaningful outcome from the survey. Here below the questionnaire (please note that AGRI4CAST Interpolated Meteorological Data is synonym of Interpolated Meteorological Data, after the name of the group taking care of the data distribution platform) :
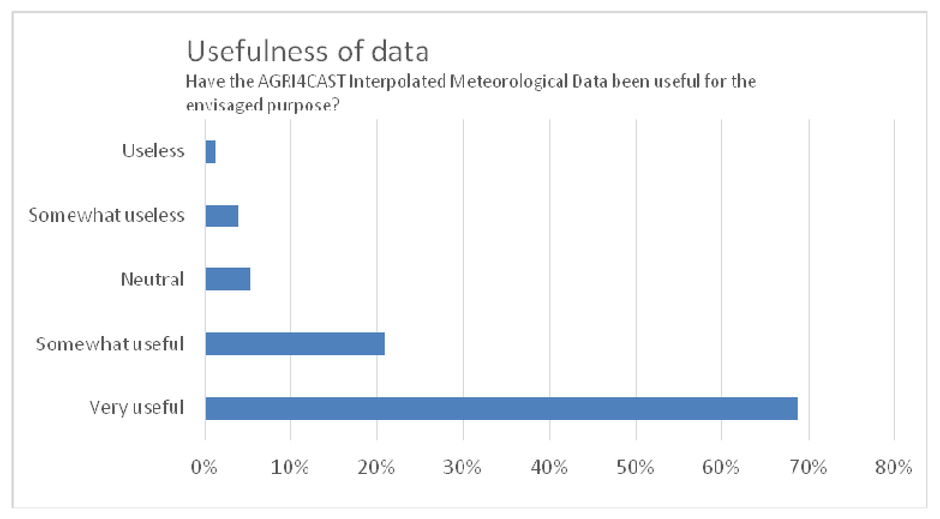
The questionnaire offered the possibility to choose more than one answer for the questions 1, 2 and 6 implying that the sum of the responses can be more than 100%. 4.2Survey outcomeThe survey was sent to the 395 users that actually downloaded data since 2011. Here, we report the analysis of the survey questions: Interpolated meteorological data served mainly the research community (77%). On a good basis, interpolated meteorological data served Consulting (19%), Education (13%), Policy Support (12%), and Business (10%) (Fig.3). Interpolated meteorological data have strongly been used both as a main and as an additional source of information, 52% and 56% respectively. Interpolated meteorological data have been also used in validation (16%) and comparison (13%) studies (Fig.4). Interpolated meteorological data proved to meet the expectations of the users, as 92% of the users have been able to use them for the intended purpose. Still, 8% of the user community re-used the information for other purposes. Indeed, 69% of the users rated the data very useful, adding 21% of useful rating. “Somewhat Useless” and “Useless” rating hardly reach 5% together. Same rating for ‘Neutral’ (Fig.5). An interesting output of the survey was that 26% of the users (Fig.6) have used the data for producing publications (papers, posters, conference proceedings). As the visibility of the service, most of the users (51%) were recommended by colleagues, 18% discovered the data through the JRC web pages, 16% contacted JRC staff directly, and 6% learnt of the data through JRC events (Fig.7). Only 9% were able to discover the service through sources other than JRC. The user community encourages the continuation of the service and highlights the importance of the meteorological data especially for scientific studies. A very important feedback is the user appreciation for free data distribution. On the other hand, users badly judged the procedure to get data through long and inefficient paper-based authorization process. Thus, the new data portal adopts an open access policy that will avoid unnecessary administrative burden for the users. A direct online registration procedure is expected to increase the number of users actually downloading data and to decrease the number of discouraged users. Authorization requests, though online, will be limited to restricted resources such as the heating and cooling degree days. Another useful feedback from users is the lack of detailed documentation for the methods of interpolation and description of the weather parameter. Finally, users suggested to implement a better dissemination strategy and increase the visibility of the current web platform. 5.METEOROLOGICAL DATA AND POLICY SUPPORTThe analysis of the projects supported by the Interpolated Meteorological Data shows that meteorological data are highly relevant for the development, implementation and assessment of a number of EU policy areas: agriculture, soil protection, environment, agriculture, food security, energy, climate change, health and sustainable development. Specific examples include: Soil Protection: Temperature and precipitation data are included in models for soil organic carbon estimation at 0-30 cm7. The rainfall data are considered as an important input factor for the estimation of erosion by water both in the past application such as PESERA8 and in recent developments such as RUSLE and G29 model. Wind speed is considered as main input factor for the qualitative wind erosion models10. Food security: The relative humidity data are used by the European Food Security Authority (EFSA) for assessment of pest risk. In research activities, precipitation and temperature data are used for the groundwater risk assessment for pesticides and pesticides exposure. Modelling activities have also used precipitation and temperature data for estimating plant health and growth at regional and European applications11. The most important use of meteorological data is the development of yield forecast at European scale implemented at the JRC and published through the MARS Bulletin3. Based on the current precipitation and temperature data and using past trends and statistical models, scientists can predict the crop growth and production of 18 crops. Environment: Modelling activities use the rainfall, humidity and temperature data for the development of biomass production indicators, fire risk indexes, flood alerts12, drought monitor data13, soil moisture datasets and air quality indicators. Agriculture: The rainfall data allow modellers to run scenarios about specific plant growth11,14 (e.g. Citrus, cotton, maize, vegetable oil) and production in various regions of Europe. Moreover, the meteorological data have been used in genomic selection framework15 of certain crops. Energy: The datasets on heating degree days are used in the energy sector for estimating the heat recovery ventilation against natural ventilation16. The same dataset and the temperature data have been used by gas market. Climate change: The meteorological datasets are time-series of more than 30 years. Those data have been also used in climate change modelling in detecting trends and identifying projections of rainfall decrease and temperature increase17. The impact of climate change to certain crops has also been investigated18. Research & Development: numerous of EU research projects in 6th and 7th framework programme (e.g. DESIRE, SEAMLESS, PRATIQUE, CARBOEUROPE, CIRCE, HAIR, GEOLAND-2, FUME) have requested the available datasets as input for their modelling activities. Health: The data are useful input for exposure assessments19 and forecasting seasonal diseases such as malaria, blue tongue. Water management and water protection: The meteorological data have been used in the implementation of scenarios for future water usage in Europe. 6.CONCLUSIONSThe European Meteorological datasets developed by Joint Research Centre (JRC) have been proved to be a useful source of information for research and modelling purposes, as revealed by a dedicated user survey. Free availability, daily updates, the temporal coverage (more than 30 years) as well as the spatial coverage (European Union, neighboring countries and North Africa) are significant advantages of this product that has been already used in several different research fields, e.g.: climate change, food security, sustainable growth and agriculture. REFERENCESGodfray H.C.J., Beddington J.R., Crute I.R., Haddad L., Lawrence D., Muir J.F., Pretty J., (&), Toulmin C.,
“Food security: The challenge of feeding 9 billion people,”
Science, 327
(5967), 812
–818
(2010). https://doi.org/10.1126/science.1185383 Google Scholar
Van der Ploeg J.D.,
“The food crisis, industrialized farming and the imperial regime,”
Journal of Agrarian Change, 10
(1), 98
–106
(2010). https://doi.org/10.1111/joac.2010.10.issue-1 Google Scholar
, Available at: MARS Bulleting,
(2014) http://mars.jrc.ec.europa.eu/mars/Bulletins-Publications Google Scholar
Becker S.O., Egger P.H., von Ehrlich M.,
“Going NUTS: The effect of EU Structural Funds on regional performance,”
Journal of Public Economics, 94
(9–10), 578
–590
(2010). https://doi.org/10.1016/j.jpubeco.2010.06.006 Google Scholar
Allen, R.G., Pereira, L.S., Raes, D., Smith, M.,
“Crop Evapotranspiration: Guidelines for Computing Crop Water Requirements,”
United Nations Food and Agriculture Organization, Irrigation and Drainage Paper 56., 300
(1998). Google Scholar
. Available at: COMMISSION DECISION of 12 December 2011 on the reuse of Commission documents (2011/833/EU),
(2014) http://ec.europa.eu/digital-agenda/en/news/rules-re-use-commission-information Google Scholar
Jones R.J.A., Hiederer R., Rusco E., Montanarella L.,
“Estimating organic carbon in the soils of Europe for policy support,”
European Journal of Soil Science, 56
(5), 655
–671
(2005). https://doi.org/10.1111/ejs.2005.56.issue-5 Google Scholar
Kirkby M.J., Irvine B.J., Jones R.J.A., Govers G., Boer M., Cerdan O., Daroussin J., Van Lynden G.,
“The PESERA coarse scale erosion model for Europe. I.-Model rationale and implementation,”
European Journal of Soil Science, 59
(6), 1293
–1306
(2008). https://doi.org/10.1111/ejs.2008.59.issue-6 Google Scholar
Panagos, P., Karydas, C.G., Gitas, I.Z., Montanarella, L.,
“Monthly soil erosion monitoring based on remotely sensed biophysical parameters: a case study in Strymonas river basin towards a functional pan-European service,”
International Journal of Digital Earth, 5
(6), 461
–487
(2012). https://doi.org/10.1080/17538947.2011.587897 Google Scholar
Borrelli, P., Panagos, P., Ballabio, C., Lugato, E., Weynants, E., Montanarella, L.,
“Towards a pan-European assessment of land susceptibility to wind erosion,”
Journal of Land Degradation, Google Scholar
Cantelaube P., Terres J.-M.,
“Seasonal weather forecasts for crop yield modelling in Europe,”
Tellus, Series A: Dynamic Meteorology and Oceanography, 57
(3), 476
–487
(2005). https://doi.org/10.3402/tellusa.v57i3.14669 Google Scholar
Ramos M.-H., Bartholmes J., Thielen-del Pozo J.,
“Development of decision support products based on ensemble forecasts in the European flood alert system,”
Atmospheric Science Letters, 8
(4), 113
–119
(2007). https://doi.org/10.1002/(ISSN)1530-261X Google Scholar
Zdruli P., Jones R.J.A., Montanarella L.,
“Use of soil and climate data to assess the risk of agricultural drought for policy support in Europe,”
Agronomie, 21
(1), 45
–56
(2001). https://doi.org/10.1051/agro:2001108 Google Scholar
van der Velde M., Tubiello F.N., Vrieling A., Bouraoui F.,
“Impacts of extreme weather on wheat and maize in France: Evaluating regional crop simulations against observed data,”
Climatic Change, 113
(3–4), 751
–765
(2012). https://doi.org/10.1007/s10584-011-0368-2 Google Scholar
Heslot N, Akdemir D, Sorrells ME, Jannink JL,
“Integrating environmental covariates and crop modeling into the genomic selection framework to predict genotype by environment interactions,”
Theor Appl Genet., 127
(2), 463
–80
(2014). https://doi.org/10.1007/s00122-013-2231-5 Google Scholar
Laverge J., Janssens A.,
“Heat recovery ventilation operation traded off against natural and simple exhaust ventilation in Europe by primary energy factor, carbon dioxide emission, household consumer price and energy,”
Energy and Buildings, 50 315
–323
(2012). https://doi.org/10.1016/j.enbuild.2012.04.005 Google Scholar
Sordo C., Frias M.D., Herrera S., Cofino A.S., Gutierrez J.M.,
“Interval-based statistical validation of operational seasonal forecasts in Spain condition to El Niño-Southern Oscillation events,”
Journal of Geophysical Research D: Atmospheres, 113
(17), D17121
(2008). https://doi.org/10.1029/2007JD009536 Google Scholar
Ferrise R., Moriondo M., Bindi M.,
“Probabilistic assessments of climate change impacts on durum wheat in the Mediterranean region,”
Natural Hazards and Earth System Science, 11
(5), 1293
–1302
(2011). https://doi.org/10.5194/nhess-11-1293-2011 Google Scholar
C.G Hoogeweg, P. Sweeney S. Zelonis, L. Fish, S. Hayes and P. Hendley, Development of EuroPEARL 2012 to Support Large-Scale Exposure Assessments and Monitoring Programs, http://www.waterborne-env.com/publications/posters/europearl_exposure.pdf Google Scholar
|