

|
|
1.INTRODUCTIONX-ray optics, including mirrors, Fresnel zone plates and compound refractive lenses (CRL), play an important role for micro- or nano-focusing in synchrotron radiation experiments. However, the push toward high resolution and sensitivity on the nanometer scale to create diffraction-limited and coherence-preserved beams requires further development of X-ray optics. This in turn demands more accurate metrology, for “if you cannot measure it, you cannot improve it.” Ex-situ characterization of optics using traditional visible light techniques, including Fizeau interferometry [1] and deflectometry, provides valuable information about predicted X-ray performance before beamline installation. However, the ultimate measure of an X-ray optic’s performance is when it’s installed on the beamline, subject to ultra-high vacuum conditions and illumination with an intense X-ray beam.. The best pathway to overcome these limitations, and help to improve the present performance of X-ray optics, is using at-wavelength (performed with X-rays) and in-situ (performed in a beamline environment) techniques [2, 3]. Over the last two decades, many at-wavelength metrology methods, such as the knife-edge technique [4], Hartmann wavefront sensors [5], Fresnel propagation iterative algorithms [6], ptychography [7], grating interferometry [8, 9] and near-field speckle based techniques [10], have been developed and used to characterize different types of X-ray optics. Among them, the grating interferometer is one of the most widespread due to its accuracy and the modest requirement of mechanical stability and transverse coherence[11]. Meanwhile, the X-ray speckle based technique allows measurement of deflection angles with a high sensitivity in a simple experimental arrangement. We present the development of X-ray grating based and speckle based techniques at the Diamond Light Source (DLS) beamline B16 [12] and show the application of these at-wavelength metrology methods for measuring the beam coherence length and the wavefront distortions of compound refractive lenses and Kirkpatrick-Baez (KB) mirrors [9, 13-16]. 2.GRATING INTERFEROMETRYThe grating interferometer consists of a phase grating acting as a beam splitter and an absorption grating acting as a transmission mask for the detector[11, 17]. The phase grating G1 was made from a silicon wafer, and the absorption grating G2 was made by covering the lines of a silicon grating with heavy materials. Two working modes are usually used for the grating interferometer: phase stepping mode, in which at least one period of a grating is scanned while the two gratings are set at the same angle with respect to the beam; and Moiré fringes analysis mode if the two gratings are tilted with respect to each other by a small angle [8, 11, 18]. The analysis of the distortion of the Moiré fringes allows one to characterize wavefront aberrations on the order of the wavelength. The X-ray wavefront radius of curvature and its distortions can be accurately measured from a single image by rotating one of the two gratings [9]. 2.1Measurement of coherence lengthThe measurement of the transverse coherence of X-ray beams is extremely important for many experiments. The intrinsic coherence properties of radiation from a synchrotron source may also be modified due to imperfections of beamline optics. The complex coherence function (CCF) can be measured from the decaying visibility of fractional Talbot distances by using two gratings to generate a Moiré pattern[19]. As described in reference [19], the CCF can be expressed with a Gaussian of the form The visibility of fringes is equal to the degree of coherence of the beam at the phase grating position. Here, the transverse coherence of the X-ray beam from the B16 beamline was measured using the grating interferometer. The grating pitches are 4μm and 2μm for the phase and absorption gratings respectively. The gratings were oriented with the grating line in the horizontal directions, and the vertical transverse coherence was measured in this case. The first grating was mounted on the stage at R=47.5m from the source, and the absorption grating was located a few millimeters in front (upstream) of the detector. An X-ray energy of 18keV was selected using a double multilayer monochromator (DMM)[20]. The distance between the two gratings was scanned, taking an image every two millimeters. As shown in Fig. 1a, the visibility of a Moiré fringe pattern will reach a maximum at the odd order fractional Talbot distances, and the visibility will drop to a minimum at the even order as shown in Fig 1c. By fitting the measured visibility as a function of the distance from the phase grating to the detector, the transverse coherence length can be derived. The measured coherence length is 20 μm at 18keV, slightly less than the theoretical value of 22 μm, as calculated usingthe DLS machine parameters. This result indicates that imperfection of the multilayer only moderately deteriorate the beamline’s coherence. Figure 1.(a-c) Moiré fringe pattern recorded at three distances of phase grating to detector: (a) odd-order fractional Talbot distance, (b) intermediate distance, (c) even-order fractional Talbot distance, (d) the experimental visibility (red curve) as a function of the distance from the phase grating to the detector, and the fitting curve (blue) using equation 1.  2.2Characterization of Compound refractive lensesA one dimensional (1D) compound refractive lens (CRL) was characterized using a grating interferometer[21]. The 1D concave parabolic lens was made of beryllium, with an aperture of 1 mm vertically and 3 mm horizontally. The radius of curvature R at the apex of the parabolas is 500μm. For a single lens, the focal length f can be calculated from the radius of curvature R of the lens at the apex of the parabolic lens by Here δBe is equal to 1.52×10⁻⁶ at the energy of 15keV, and the corresponding focal length f is 164.5 m. The 1D CRL and grating shearing interferometer were mounted on three motorized towers on a versatile optics test bench in the experimental hutch of the B16 beamline. The distance between the source and lens was 46.6m, and the grating G1 placed 0.5m downstream from the lens. The energy was set to 15 keV by a silicon double-crystal monochromator (DCM). An X-ray 2D CCD detector with indirect illumination and an effective pixel size of 6.4μm was used. The lens was mounted such that it focused in the vertical plane. No other focusing optical elements were used upstream of the CRL. The gratings were oriented with the grating line in the horizontal directions, giving access to the vertical wavefront gradient. A single 1D CRL was tested at different tilt angles θ between the axis of the lens and the incident X-ray beam. Phase stepping mode was used with 96 images recorded during a piezo scan over two periods of the grating, with an exposure time of 400ms. Fig.2 summarizes the amplitude image (top), dark-field image (middle) and phase gradient image (bottom) for single 1D CRL at 0 and 30 degrees. The field of view decreased as the CRL rotates from 0° to 30° and scattering is more visible at the edge of the CRL from the dark-field image. In addition, the effective radius of curvature of the lens at the apex was calculated from the phase gradient map to be 503μm and 432μm at 0° to 30°, respectively. The experimental data proves that the focal length changes as the CRL rotates according to equation 2. Therefore, it provides valuable input for the proof of the principle for maintaining the focal position by rotating the 1D CRL as the photon energy is varied. 2.3Optimization of a bimorph mirrorAn X-ray grating interferometer was employed for in-situ optimization of an X-ray bimorph mirror. Moiré fringe analysis was used to calculate the wavefront slope error [9, 16]. Only a single interferogram image captured outside the focal plane is required, enabling the optical surface to be quickly measured and optimized. The 8 piezo electrodes enable the substrate to be bent to a large range of cylinders or ellipses. The mirror’s figure was pre-polished as a tangential ellipse whose foci are located at distances p = 41.5 m (source) and q = 0.4 m (image) from the bimorph mirror when no voltages are applied to its electrodes [22]. Phase grating G1, with a pitch of d1 = 3.99 μm, was mounted on a rotation stage. Absorption grating G2, with a pitch of d2 = 2.00 μm, was fabricated by depositing electroplated gold onto a silicon grating. Silicon substrates for both gratings were etched to a 50 μm thickness to minimize X-ray absorption. The grating G1 was placed at a distance 720 mm downstream of the mirror’s focal plane, and the inter-grating distance, G1 to G2, was set to 33 mm. To determine the optimum voltages which minimize slope errors, an initial interferogram was collected with all piezo voltages set to 0 V as shown in Fig.3(a). Fig. 3(b) shows an interferogram after the first three electrodes’ voltages had been incremented to 400 V. As highlighted in the region marked by a line, the fringes were distorted after applying the voltages on the piezo actuators. Wavefront slopes were calculated using the method described in reference [8]. As shown in Fig. 3(c), the response of the jth electrode is calculated by subtracting the slope extracted from the jth and (j+1)th image. It can be seen that the slope change induced by each piezo actuator is below 0.01μrad/V. An interaction matrix, which defines the response of each electrode per unit voltage change (so called piezo response functions), can then be constructed and used for the mirror optimization [23]. The detailed optimization procedure and the results can be found in reference [16]. Since only single interferograms are required for each voltage set, the optical surface can be quickly optimized. In this case, the slope error of a bimorph mirror was reduced to < 200 nrad (rms) in only two iterations for a range of ellipses. Figure 3.Interferograms with (a) 0 V applied to all electrodes (b) 400V applied to first three electrodes only. (c) Piezo response functions of the bimorph mirror showing the slope change induced by applying a fixed voltage to each piezo actuator in sequence. Here line 1-0 represents the slope response of the 1st electrode found by subtracting the 0th image (no voltages applied) from the 1st image (voltage only applied to 1st electrode). 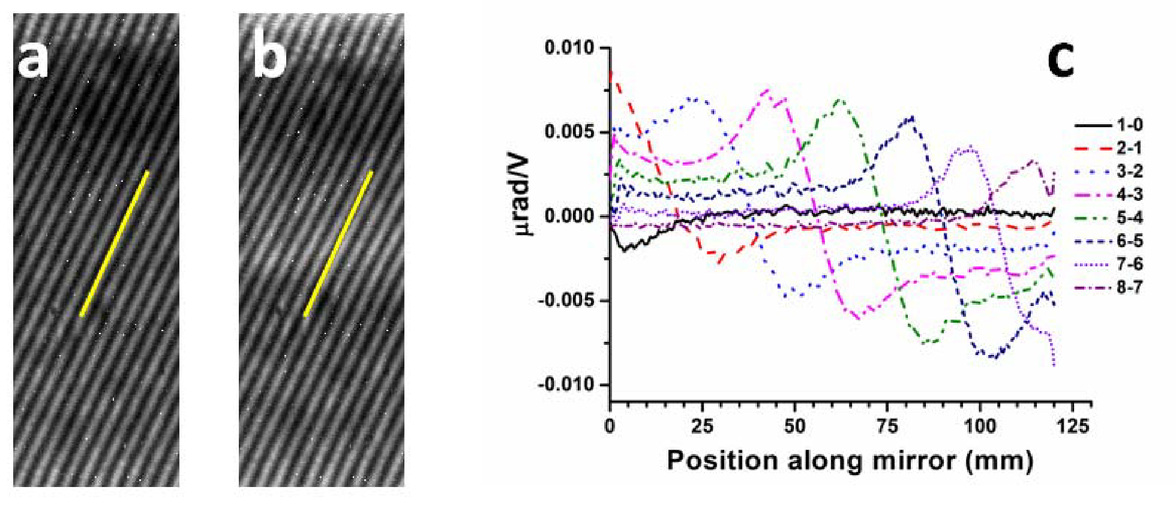 2.4In-situ metrology of X-ray KB mirrorApart from the X-ray wavefront characterization, the grating was also used as a deflectometer to measure the mirror’s slope error [24]. In this case, only one absorption grating was mounted on a piezo translation stage located upstream of the test mirror. A pair of X-ray KB mirrors was characterized using the grating deflectometer. For the vertical focusing mirror (VFM), the mirror’s figure was polished to a tangential ellipse with: p = 47.11m and q = 0.125m; and a grazing incident angle θ of 3mrad. The pitch of the grating is 10μm such that the fringes can be resolved by the CCD camera thanks to the magnification effect. The effective pixel size of camera was 6μm, and the camera was placed outside the focal plane. The distance between the mirror and detector is 3125mm. This large distance increases both angular sensitivity and spatial resolution through the magnification offered by the focusing mirrors. The fringes for the VFM are shown in Fig. 4(a). Note that the fringe period is much larger for the top region than the bottom region. This indicates that the wavefront gradient varied gradually due to the change in the radius of curvature along the mirror’s elliptical surface. The grating was scanned, using the piezo actuator, in the direction perpendicular to the grating lines, and an image recorded for each position of the grating. A stack of 64 images was recorded by scanning the piezo over 20μm, which is equivalent to two periods of the grating pitch. The phase of the projected fringe was then recovered for each detector position. In order to retrieve the mirror’s slope error, an iterative procedure was employed and described in reference [24]. The recovered mirror slope error was then compared with that measured by the Diamond-NOM. Fig.4(b) shows that the ex situ measurement and the in situ measurements are in good agreement. 3.X-RAY NEAR FIELD SPECKLE BASED TECHNIQUEThe X-ray speckle based technique is able to quantitatively analyze the wavefront of a partially coherent X-ray beam [10, 13, 25, 26]. The setup requires only a random phase object and a 2D detector to resolve high-spatial frequency features contained in the object. A solid membrane, easy to align and with low sensitivity to vibrations, produces a random intensity pattern (speckle). It can be understood as a high spatial frequency modulation of the wavefront intensity using motionless speckle to trace the geometrical path of the light passing through each pixel of the detector. The speckle based technique may be performed in one of three operating modes [10, 13]: absolute mode; differential mode; and scanning mode. For absolute mode, the speckle pattern was collected by either moving the membranes or the detector along the beam direction. This can be used for the wavefront characterization. Differential mode is operated by recording the speckle pattern with and without a test sample in the beam. The speckle displacement for the two modes can be tracked using a digital image correlation algorithm capable of sub-pixel accuracy. Scanning mode utilizes a membrane scanned across the beam with a piezo stage. In addition to absorption, phase, and dark field imaging, the effective local wavefront curvature can also be measured using the speckle scanning mode [13]. 3.1Wavefront characterizationAs a simple illustration [10], the X-ray wavefront from the bending magnet source of B16, after passing through a Si(111) DCM, was measured using absolute mode. The membrane was placed at 47.5m from the source, and the X-ray energy was set at 14.5keV. The beam size of 2mm × 2mm was defined using slits. The first speckle image was collected with the detector 600 mm from the membrane, and a second image acquired by moving the detector 100mm further downstream. Fig. 5 (a) shows the reconstruction of the beam wavefront, which was then fitted with an ellipsoidal shape. The best-fit radii of curvature of the wavefront are 49.7m and 48.8m for the vertical and the horizontal direction, respectively. The difference between the two orthogonal directions might be due to the heat load imposed on the DCM. The corresponding wavefront error shown in Fig. 5(b) might have been introduced by imperfections of the monochromator crystals or the beryllium windows. 3.2Measurement of compound refractive lensesAs a demonstration, a 2D CRL was characterized using the speckle differential mode [10]. The CRL was made of beryllium and had a parabolic shape with a design radius of curvature 200μm at the apex. The beam energy was set to 15keV using a Si(111) DCM of the beamline B16. As illustrated in Fig.6, two images were recorded: (a) one without the CRL in the X-ray beam and (b) the other with the lens. A sub-pixel accuracy, zero-normalized, cross-correlation algorithm was employed to calculate the displacement vector for each pixel from the two images. By dividing the displacement by the distance between the lens and the detector, both (d) the horizontal and (e) the vertical wavefront gradient can be calculated. The reconstructed wavefront, illustrated in Fig. 6 (f), shows dramatically enhanced contrast compared to the absorption image (c). The corresponding aberrations of the parabolic, rotationally symmetric lens can be retrieved from the wavefront profile. Such aberrations are difficult to measure using other techniques. Precise measurement of the refractive properties is essential for further improvement of the lens fabrication process, especially in the context of efforts to achieve ever smaller X-ray focal spot sizes. 3.3Characterization and optimization of an X-ray mirrorAs described in reference [13], the grating technique is a special case of the general speckle scheme in which the membrane is scanned across the incoming beam. Absolute wavefront curvature, which is the second derivative of the wavefront, can be accurately retrieved in scanning mode. Hence, for grating deflectomety, the grating can be replaced with a membrane to measure the X-ray mirror’s slope error. Reference [15] demonstrates that the surface profile of the same pair of X-ray KB mirrors has been recovered based on near-field speckle with nanometer height precision. Apart from the mirror profile characterization, the speckle based technique has also been used for optimizing a bimorph mirror. The differential mode was used to measure the piezo response functions, and scanning mode was then employed to measure the absolute wavefront error. The X-ray mirror can be optimized to focus or defocus beams by applying the derived voltage on each piezo actuator [22]. 4.SUMMARYThe grating interferometer and X-ray speckle tracking technique are both established and commissioned at the Diamond Light Source beamline B16. Both techniques are compact, robust and have no stringent requirements on longitudinal and transverse coherence. We show that sub-μrad precision in the wavefront gradient is achievable using these techniques. Both grating interferometry and X-ray speckle based techniques fulfill the requirement for optimization of future diffraction-limited optics. These techniques are valuable for the improvement of the manufacture and in-situ optimization of the new generation of X-ray optics. They thereby complement other phase retrieval methods for in-situ and at-wavelength metrology, as is essential for the routine use of future focusing optics capable of nanometer performance. These metrology methods could open new possibilities for optics characterization. AcknowledgmentsThis work was carried out with the support of the Diamond Light Source Ltd UK. The authors wish to thank Yong Chu from NSLS II for providing the CRL, and Christian David and Simon Rutishauser from PSI for fabricating the gratings used in this experiment. We would like to acknowledge Andrew Malandain for his technical assistance. REFERENCESS. G. Alcock, K. J. S. Sawhney, S. Scott,
“The Diamond-NOM: A non-contact profiler capable of characterizing optical figure error with sub-nanometre repeatability,”
Nuclear Instruments and Methods in Physics Research Section A: Accelerators, Spectrometers, Detectors and Associated Equipment, 616
(2–3), 224
–228
(2010). https://doi.org/10.1016/j.nima.2009.10.137 Google Scholar
K. Sawhney, H. Wang, J. Sutter,
“At-wavelength Metrology of X-ray Optics at Diamond Light Source,”
Synchrotron Radiation News, 26
(5), 17
–22
(2013). https://doi.org/10.1080/08940886.2013.832586 Google Scholar
J. Sutter, S. Alcock, and K. Sawhney,
“In situ beamline analysis and correction of active optics,”
Journal of Synchrotron Radiation, 19
(6), 960
–968
(2012). https://doi.org/10.1107/S090904951203662X Google Scholar
O. Hignette, A. K. Freund, E. Chinchio,
“Incoherent x-ray mirror surface metrology,”
in Proceedings of SPIE,
188
–199
(1997). Google Scholar
M. Idir, P. Mercere, M. H. Modi,
“X-ray active mirror coupled with a Hartmann wavefront sensor,”
Nuclear Instruments and Methods in Physics Research Section A: Accelerators, Spectrometers, Detectors and Associated Equipment, 616
(2–3), 162
–171
(2010). https://doi.org/10.1016/j.nima.2009.10.168 Google Scholar
H. Yumoto, H. Mimura, S. Matsuyama,
“At-wavelength figure metrology of hard x-ray focusing mirrors,”
Review of Scientific Instruments, 77
(6), 063712-6
(2006). https://doi.org/10.1063/1.2216870 Google Scholar
C. M. Kewish, M. Guizar-Sicairos, C. Liu,
“Reconstruction of an astigmatic hard X-ray beam and alignment of K-B mirrors from ptychographic coherent diffraction data,”
Opt. Express, 18
(22), 23420
–23427
(2010). https://doi.org/10.1364/OE.18.023420 Google Scholar
T. Weitkamp, B. Nohammer, A. Diaz,
“X-ray wavefront analysis and optics characterization with a grating interferometer,”
Applied Physics Letters, 86
(5), 054101
–3
(2005). https://doi.org/10.1063/1.1857066 Google Scholar
H. Wang, K. Sawhney, S. Berujon,
“X-ray wavefront characterization using a rotating shearing interferometer technique,”
Opt. Express, 19
(17), 16550
–16559
(2011). https://doi.org/10.1364/OE.19.016550 Google Scholar
S. Berujon, E. Ziegler, R. Cerbino,
“Two-Dimensional X-Ray Beam Phase Sensing,”
Physical Review Letters, 108
(15), 158102
(2012). https://doi.org/10.1103/PhysRevLett.108.158102 Google Scholar
C. David, B. Nohammer, H. H. Solak,
“Differential x-ray phase contrast imaging using a shearing interferometer,”
Applied Physics Letters, 81
(17), 3287
–3289
(2002). https://doi.org/10.1063/1.1516611 Google Scholar
K. J. S. Sawhney, I. P. Dolbnya, M. K. Tiwari,
“A Test Beamline on Diamond Light Source,”
in AIP Conference Proceedings,
387
–390
(2010). Google Scholar
S. Berujon, H. Wang, and K. Sawhney,
“X-ray multimodal imaging using a random-phase object,”
Physical Review A, 86
(6), 063813
(2012). https://doi.org/10.1103/PhysRevA.86.063813 Google Scholar
H. Wang, S. Berujon, I. Pape,
“X-ray wavefront characterization of a Fresnel zone plate using a twodimensional grating interferometer,”
Opt. Lett, 38
(6), 827
–829
(2013). https://doi.org/10.1364/OL.38.000827 Google Scholar
S. Berujon, H. Wang, S. Alcock,
“At-wavelength metrology of hard X-ray mirror using near field speckle,”
Optics Express, 22
(6), 6438
–6446
(2014). https://doi.org/10.1364/OE.22.006438 Google Scholar
H. Wang, K. Sawhney, S. Berujon,
“Fast optimization of a bimorph mirror using x-ray grating interferometry,”
Optics Letters, 39
(8), 2518
–2521
(2014). https://doi.org/10.1364/OL.39.002518 Google Scholar
M. Atsushi, K. Shinya, K. Ichiro,
“Demonstration of X-Ray Talbot Interferometry,”
Japanese Journal of Applied Physics, 42
(7B), L866
(2003). Google Scholar
T. Weitkamp, A. Diaz, C. David,
“X-ray phase imaging with a grating interferometer,”
Opt. Express, 13
(16), 6296
–6304
(2005). https://doi.org/10.1364/OPEX.13.006296 Google Scholar
F. Pfeiffer, O. Bunk, C. Schulze-Briese,
“Shearing Interferometer for Quantifying the Coherence of Hard X-Ray Beams,”
Physical Review Letters, 94
(16), 164801
(2005). https://doi.org/10.1103/PhysRevLett.94.164801 Google Scholar
K. J. S. Sawhney, I. P. Dolbnya, S. M. Scott,
“A double multilayer monochromator for the B16 Test beamline at the Diamond Light Source,”
8139 813908
–813908-8 Google Scholar
H. Wang, S. Berujon, and K. Sawhney,
“Characterization of a one dimensional focusing compound refractive lens using the rotating shearing interferometer technique,”
in AIP Conference Proceedings,
223
–228
(2012). Google Scholar
K. Sawhney, S. Alcock, J. Sutter,
“Characterisation of a novel super-polished bimorph mirror,”
Journal of Physics: Conference Series, 425
(5), 052026
(2013). Google Scholar
R. Signorato, O. Hignette, and J. Goulon,
“Multi-segmented piezoelectric mirrors as active/adaptive optics components,”
Journal of Synchrotron Radiation, 5
(3), 797
–800
(1998). https://doi.org/10.1107/S0909049597012843 Google Scholar
S. Berujon, and E. Ziegler,
“Grating-based at-wavelength metrology of hard x-ray reflective optics,”
Opt. Lett, 37
(21), 4464
–4466
(2012). https://doi.org/10.1364/OL.37.004464 Google Scholar
S. Berujon, H. Wang, I. Pape,
“X-ray phase microscopy using the speckle tracking technique,”
Applied Physics Letters, 102
(15), 154105-4
(2013). https://doi.org/10.1063/1.4802729 Google Scholar
K. S. Morgan, D. M. Paganin, and K. K. W. Siu,
“X-ray phase imaging with a paper analyzer,”
Applied Physics Letters, 100
(12), 124102-4
(2012). https://doi.org/10.1063/1.3694918 Google Scholar
|


