|
|
1.INTRODUCTIONAt the Offenburg University the students of the faculty Media and Information Engineering and Design get a crossmedia insight into the world of media. In many practical projects they realize print products, films, animations, online projects or Apps. With a broad supply of teaching events all theoretical scientific basics are offered and conveyed intensively. We experience a steadily rapid ongoing development in the field of image capturing technologies and display technologies. The rapid technological progress represents a big challenge. Hardly any other line of business changes in such a high speed. New technologies, equipment and applications are changing the media world and the use of media. [20] 2.COLOR MANAGEMENTColor management took its beginnings in the color reproduction of the pre-press. It developed quickly from the transition of the electronic color reproduction to the desktop publishing with a lasting technical change in the 1980’s and 1990’s. All these technological changes are designed for the interchangeability of digital color information. In 1993 and 1996 the standardization committees ICC (International Color Consortium) and the ECI (European Color Initiative) were founded. This was the beginning of color management. These committees worked out open standards for color profiles of input and output devices. The first steps toward a working color management system were made. [1] - [4], [20] ICC color management is an important part of color reproduction. The aim is to ensure the best possible color consistency during the production workflow between different input and output devices. The color management system works with a device-independent color space which is described as profile connection space (PCS). Every device in the production workflow has a particular standardized technical device-profile. It contains the definition of the devicedependent color space. Device-dependent color spaces are often very different in its reproducible color scale. The use of a device-independent color space (medium neutral) decouples them of each other. Now it is possible to convert image data into different technical color spaces with a high color consistency. [1] - [4], [20] In color management a development takes place away from the classic print products to the digital output devices and mobile displays. The media usage changes very strongly across the society. Smartphones and Tablets get more and more importance. The use of these mobile devices is a matter of course today. This trend also extends to the media industry, where tablets have already established a strong presence in the graphics industry and are increasingly in use. This definitely increases the requirement for matching color management solutions. In this development, the printing industry again is playing a leading role. For a long time printed contact proofs were in the center of the communication between customer and printing department. This role will be taken over more and more by soft proofing (monitor proofing) systems. It is a great challenge for all partners in the printing industry. Soft proofing systems rely on calibration, profiling and color management to produce an accurate representation of how images will look like when printed. Many factors can contribute towards considerable different representations of an image template and its monitor rendering despite of smallest metrological color distances, best hardware and software. The sum of all influences on the complete system must be standardized and correct. [2] - [4] 3.DIGITAL DEVICESMonitors are in the center of media productions and hold an important function as the main visual interface. The current devices for professional use provide a wide color range and shall be calibrated very precisely in order to achieve the best possible desired color representation. Tablets and smartphones become more and more important work tools in the media industry. The quality requirements to the color representation have grown significantly. Color accuracy, as it is a standard in the print production for a long time, is largely ignored on all mobile devices. At the moment, tablets and smartphones possess no calibration option, hardware display settings are not possible. This is reflected by the partly very different color representation of graphical data on the individual devices. 3.1MonitorsSoft proofing is the representation of color data on a precisely calibrated and high resolution computer monitor with the purpose to generate the color appearance of the colors described by the data for certain types of lighting and environmental conditions. Such an accurate color representation requires a colorimetric definition of the database. Soft proofs require an accurate color management software to show the exact hues and brightness of the data. The monitor has a crucial importance. [7], [8] Currently, LCD (Liquid Crystal Display) widescreen monitors are typically used in media production. A key criterion for the selection of a monitor for a Color Management System is the used LCD panel type, because their different characteristics have a strong influence on the color representation. LCD monitors with IPS (in-plane switching) panels are best suited. They provide very low viewing angle dependence, which is essential for the commonly used widescreen monitors. Although IPS panels have a lower brightness contrast than VA (vertical alignment) or TN (twisted nematic) panels, they are still more than adequate for a color-proof representation. [12] For the image quality a uniform color representation over the entire screen is crucial (homogeneity). The gamut of a monitor is determined by the used technology and is device dependent. In principle, the gamut must be at least large enough to represent all necessary colors. One aspect of the color gamut is the brightness contrast. This is expressed in the luminance ratio of white and black point and should be at least 200:1. For the absolute brightness, a luminance of 150-200 cd/m2 is necessary, which should be obtained after the calibration of the monitor to the desired white point. 5000 K are used in the media industry typically. Another important requirement is the temporal and local stability. The reproduced colors must be constant over the whole screen surface within close tolerances. [7], [8] 3.2Mobile devicesNowadays color management and mobile devices do not fit together. Modern displays offer a lot and become more and more efficient and powerful. Unfortunately, the development goes to brighter and more colorful displays, which don’t show reality. To be able to use this improving technology reasonably, this unsatisfactory situation has to be changed. Only a color management operating system level allows accurate color representation. However, iOS and Android don’t offer this possibility. This means that color profiles embedded into images aren’t utilized. Applications like iPhoto also don’t support embedded color profiles. Every application handles these color profiles differently. This leads to different color representations of the identical image. Today the trend is towards updating the desired functionality by special applications to get a light version of color management. The IPS-LCD technology is used preferentially for mobile devices. This technology offer many advantages like low viewing angle dependence. Particularly this is very important at low viewing distance and frequent movement of the display. Additionally, this display technology is very insensitive to touch and enables a very low response time. Due to the LED (light-emitting diode) backlight, the power consumption of these devices is very low and the battery life is very good. Meanwhile, more and more AMOLED (active-matrix organic light-emitting diode) displays are used which have an easy construction and permit quick switching times. AMOLED displays are considerably thinner and can be produced substantially more favorably. Compared to LCD’s they offer some advantages like low energy consumption over LCD displays and a very high luminosity. As the used materials are clearly short-lived, AMOLED displays must be encapsulated airtight, because the contained materials can oxidize quickly which would causes defects. The color space of different IPS-LCD’s looks relatively similar, because they orientate themselves more or less at the sRGB-color space. AMOLED are clearly an exception as they represent considerably more colors particularly in the green range of the light spectrum. [5], [10], [14] - [16], [17] 4.THEORETICAL BACKGROUNDTo understand the basic idea of color management the students need a broad theoretical scientific know-how. To convey this know-how, we work step by step. „From light to the color“ includes the scientific theories and knowledge of Newton, Maxwell, Hertz, Young, Brewster, Helmholtz, von Kries and Hering. „Development of the color representation“ contains the CIE human observer and the color-matching functions, the CIE chromaticity diagram, the CIE Lab color space and other color models. „From CIE-Lab color space to color management” continues the way towards the ICC color management, ICC profiles, gamut mapping and rendering intents. [20] In an extension of the lecture contents an intensive discussion of different display technologies and its applications is taking place now. The established LCD technology and the promising OLED (organic light-emitting diode) technology are in the focus. The classic LCD is now the most important display technology. LCD’s are used in all sorts of flat screens and is currently the predominant technology used in mobile devices. The function of this display technology is based on the fact that liquid crystals affect the polarization direction of light, when a defined electrical voltage is applied. There are different panel technologies used to form the color representation of an LCD. Panels with twisted nematic technology have the abbreviation TN, panels with vertical alignment technology have the abbreviation VA. [6], [9], [11], [12], [18] A further development is the Super LCD which offers a higher sharpness, better contrast and a wider viewing angle than a classical LCD. The latest LCD technology is called Super LCD 2. It is based fundamentally on the so-called IPS displays. IPS describes a special technology for LCD’s that improves especially the viewing angle stability. Retina display is a marketing concept of Apple. Retina Displays are customary LCD’s with IPS technology with a very high resolution. The idea behind the concept “Retina” is that that the resolution of the display should be so high that the human eye cannot recognize single image points from a typical viewing distance. Therefore the display representation looks extremely sharp and detailed and offers very good brightness and contrast values. [5], [11] - [14], [17] The OLED technology is based on the fact that certain polymers emit light. Because every sub-pixel itself becomes the source of light, no background lighting is necessary. Behind its ability to switch on or off the light emission are certain natural combined organic molecules which have semiconductor behaviors and are therefore suitable for the transportation of electrical charges. OLEDs made of small molecules or polymer materials need only one single substrate. Therefore, OLEDs can be produced as extremely thin layers. Because of the thin-film structure OLEDs achieve excellent visual qualities (high contrast and brilliant colors) and a highly precisely light emission with a low viewing angle dependency. Their energy consumption is very low. [6], [9], [19] AMOLED is an advancement of the classical OLED. The difference exists primarily in the control of the single pixels. The organic light-emitting diodes are controlled in their entirety as active matrix by using transistors. The color representation seems always evenly illuminated and is virtually independent of the viewpoint. Super-AMOLEDs are using the so-called Pen-Tile matrix with the layout pattern red, green, blue, green (RG-BG). This special arrangement ensures that the real resolution remains the same, but a third of the sub-pixels are missing compared to a normal pixel arrangement. The latest development is the Super-AMOLED plus. For these display technology the Pen-Tile matrix is replaced by the Real-Stripe technology. Now every pixel contains the three colors red, green and blue. The resolution of the display becomes clearly higher and single pixels are not recognizable any more. In addition, the black values were improved, the contrast increased and the battery drain lowered again. [5], [9], [10], [13] - [17] 5.APPLICATIONSThe students should develop sense of the color representation on screens besides the theoretical scientific basics. For that purpose various monitors and displays are measured with different gauges. We want to reach a sensitization for the topic of color management and show the differences in the color representation of different display technologies. But also the technical side of the display technologies is moved increasingly into the focus of our practical lectures. 5.1Liquid Crystal Display in the do-it-yourselfTo develop a deeper understanding the students have to build simple LCDs themselves. A custom simple motive is transferred to the leading coated sides of the two display glass tops. It is important to check the tightness of the design, since the non-protected places of the conductive layer are removed in an etching bath in the next step. The two glass tops are then cleaned and oxidized to get a transparent display. After the oxidization further cleaning by boiling is necessary. Both glass tops are oriented on the coated sides by grating in 90° moved direction and are provided with prepared distance holders and glued together there. After the glue is dry, the screen is filled with liquid crystals. By the capillary effect these spread out between the two glass tops automatically. Now the cleaned still open sides of the display must be sealed airtight with adhesive. Because the display has no backlight, it must be work with incident ambient light. To make his possible, a reflector layer which carries a polarization layer at the same time is stuck on the back. A second transparent polarization foil is stuck on to the front side. Depending on the orientation of the polarization foil the display shows a bright image on a dark background or a dark image on a light background if the voltage supply is applied. 5.2Colors and digital display devicesThe first testing environment uses the Konica Minolta CRT Color Analyzer CA-100 with the software LabVIEW 5.0 (National Instruments). With different tasks the students are to be introduced to the color representation on screens and displays. The CRT monitor has to be adjusted to true color mode. Initially the students have to measure the primary colors red, green and blue of the monitor with the color analyzer. Then the secondary colors cyan, magenta and yellow are to be measured as well as white and black. The measured values are to be graphed into a self-prepared norm chromaticity diagram. This task serves to objectify the color impression on a screen so that at misrepresentations of colors suitable countermeasures can be taken up. [20] Figure 3.The testing environment of the Konica Minolta CRT Color Analyzer CA-100 and the measurement environment of the spectrometer JAZ (Ocean Optics) for differently colored LEDs.  To sharpen the understanding of the color representation, two primary colors are to be selected for a dithering field. The raster should be adjusted on values 200, 100, 50, 10. Then the selected colors must be reproduced over three regulators for red, green and blue and are to be measured for comparison purposes. This is a very good training for the visual color perception. The effective direction of the three basic color channels is trained intensively. [20] Now the color temperature of the monitor has to be determined. A color field is to be adjusted for white and then the values for Yxy are to be measured. The black body spectrum of the measured color temperature will be represented with the software. Then the students have to calculate the corresponding tristimulus values. The values of the measured white are to be graphed into the norm chromaticity diagram and then Δuv is to be interpreted. [20] Finally the students have to work with color rows. The first step is to differentiate neighboring color fields. This is only possible if the difference between neighboring color fields is big enough. With the help of the software own color rows can be produced. Simultaneously the color values of the color analyzer can be saved and represented on the computer. With the help of suitable color rows it is possible now to declare the Gamut of the monitor. In the same way the gray row is to be measured and then the brightness curve is to be explained. Now contrast and brightness of the monitor have to be varied and more brightness curves have to be taken for a determination of the gamma value. A visual rough determination of the gamma has to be carried out with a test card. [20] 5.3More possibilities with the spectrometer JAZMuch new interesting possibilities offer the spectrometer JAZ of Ocean Optics. At first the students measure different lamps to get some basic knowledge about the device. The spectrum of a glow-discharge lamp will be measured. With the measured values is to decide what kind of glow-discharge lamp it is. [20] Base for the next measurement series are differently colored LEDs. The different spectra of the LEDs are to be transfered in a graph. With constant power the voltage of the LEDs are to be measured and the wavelength of the colored diodes has to be determined. In the Software are different illuminant standards deposited. One of them has to be selected for the white diode. First a reference spectrum is to be taken with this standard and after this a dark spectrum. Then the other diodes are to be measured in the norm color field. The measurement series is to be repeated with further deposited illuminant standards. All measured xy values are to be graphed into a norm chromaticity diagram. [20] 5.4Color representation on digital devicesThe focus of the measurement lays on the color representation on different displays. The portfolio of available digital devices has been significantly extended. At first only mobile devices with iOS operating system could be calibrated with the color calibration solution Spyder (Datacolor) via the App SyderGallery. Meanwhile the software was developed further and is now available for devices with Android operating system. In addition, another gauge the i1Display of x-rite has been acquired. With the App ColorTRUE it is also possible to calibrate mobile devices with both operating systems. Finally, mobile devices of different manufacturers with different display technologies can now be used for the measurements. That represents the everyday media use in the society much better. [20] Several digital output devices are available. On a monitor, a laptop, a tablet and a smartphone the same prepared test card is displayed. At first the image representation has to be evaluated visually and then measured with the spectrometer on every device. The visual assessments and the measurements have to be correlated with each other. The next task is to calibrate the three devices with a color calibration solution. After the calibration the identical test card is represented once again. By the use of two different colorimeters a second series of experiments can be performed now. It is possible to compare the calibration quality of both gauges. Again the representation of the test card has to be evaluated visually and then measured. The results have to be correlated with each other and discussed. To demonstrate the strong influence of the environment conditions on the color representation, different lighting situations will be created. Particularly mobile devices are strongly affected by it. This makes clear again how important a standardized workflow and a defined environment for the media production is. [20] Finally the same test card is represented in four different color spaces on a calibrated LCD monitor. This visually often means an obvious change of the color representation. The changes have to be evaluated visually very detailed and then measured. With Adobe Photoshop it is possible to get for every represented color field its color values. The values have to be graphed in a two-dimensional chroma diagram in which the luminance is neglected. Then the color difference ΔE between same color fields represented in different color spaces has to be calculated. It is very important to establish a correlation between the results. The students develop a good appreciation of the mode of action of different color spaces for the same data. [20] 6.RESULTSStudents need a practical part to develop a better comprehension of the color representation in the media. To convey and deepen the important theoretical basics practical tests and exercises are essential. The students can be confronted with practical problems. Through the problems solution theoretical scientific backgrounds can be deepened very well. A strong sensitization for important topics like color representation and color management should take place. Very positive results are seen at the end of the series of lectures. Especially the objectification of the color impression and the training of the visual color perception have a very positive effect. [20] By covering and dealing with the most important display technologies which are used nowadays in mobile devices, we have managed to convey another important aspect of media technology. Just these display technologies have a determining influence on the color representation. A clear sensitization of the students takes place. With the use of different mobile devices we cope with the strongly changed media usage and extend the theoretical knowledge base clearly by important aspects. This advanced knowledge has a positive effect on the various design projects. A deeper understanding is created just in the area of the digital color representation. By using different display technologies, a broad comparison base is created which is very important especially for cross-media productions. [20] Predictability and consistency in the color representation are the aims of a color management system. This is only possible in a standardized and audited production workflow. The importance to calibrate the devices is demonstrated very plastically. Consequences of the choice of a defined color space on the color representation lead to aha moments again and again. By using different gauges and a larger number of different digital devices, we get closer to our aim, to expand the practical education in scientific and production-related form even more. But it is still necessary to improve the learning infrastructure more. With a composite form of theoretical and practical lectures very positive results can be achieved. Seen from the point of view of knowledge transfer, these results point the way toward more practical education in a scientific but applied direction. It has to be considered that design and development of a suitable learning environment with the required infrastructure and corresponding investments are necessary. [20] REFERENCESSimon, K., Farbe im Digitalen Publizieren, Springer-Verlag Berlin Heidelberg(2008). Google Scholar
Kusterka, W., Colormanagement in der Farbreproduktion, Verlag Dr.-Ing. Paul Christiani GmbH & Co. KG, Konstanz
(2012). Google Scholar
Fiebrandt, D., Koch, C., Farbkonsistenz in der Profifotografie, Addison-Wesley Verlag, München
(2010). Google Scholar
Homann, J., Digitales Colormanagement, Springer-Verlag Berlin Heidelberg(2007). https://doi.org/10.1007/978-3-540-35442-0 Google Scholar
Soneira, R. M.,
“Tablet display technology shoot-out,”
(2014) http://www.displaymate.com/SID_Tablet_Display_Technology_Shoot-Out_1.htm Google Scholar
Tsujimura, T., OLED Display Fundamentals and Applications, John Wiley & Sons, (2013). Google Scholar
***, “Definition des Softproof,”
(2014) http://www.fogra.org/fogra-forschung/medienvorstufe/forschungsthemen-medienvorstufe/10047-softproof/grundlagen-softproof/defintion-softproof.html Google Scholar
***, “Fogra Softproof Handbuch,”
(2014) http://www.fogra.org/dokumente/upload/5c87b_fogra_softproof_handbuch_v2.pdfl Google Scholar
Den Boer, W., Active matrix liquid crystal displays, Elsevier, (2005). Google Scholar
Seger, A.,
“AMOLED, LCD & CO: Displaytechnologien für Smartphones im Überblick,”
(2014) http://www.areamobile.de/specials/19982-amoled-lcd-und-co-display-technologien-fuer-smartphones-im-ueberblick Google Scholar
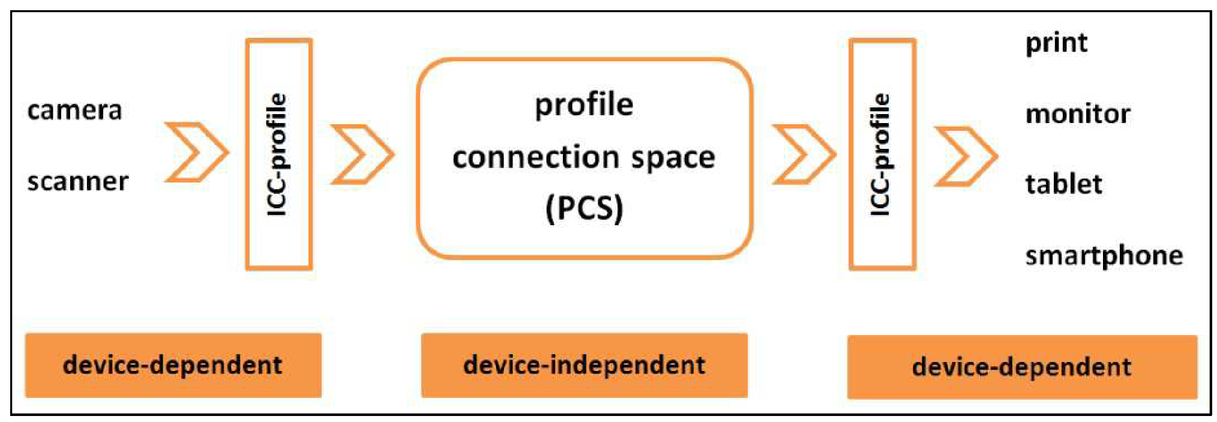
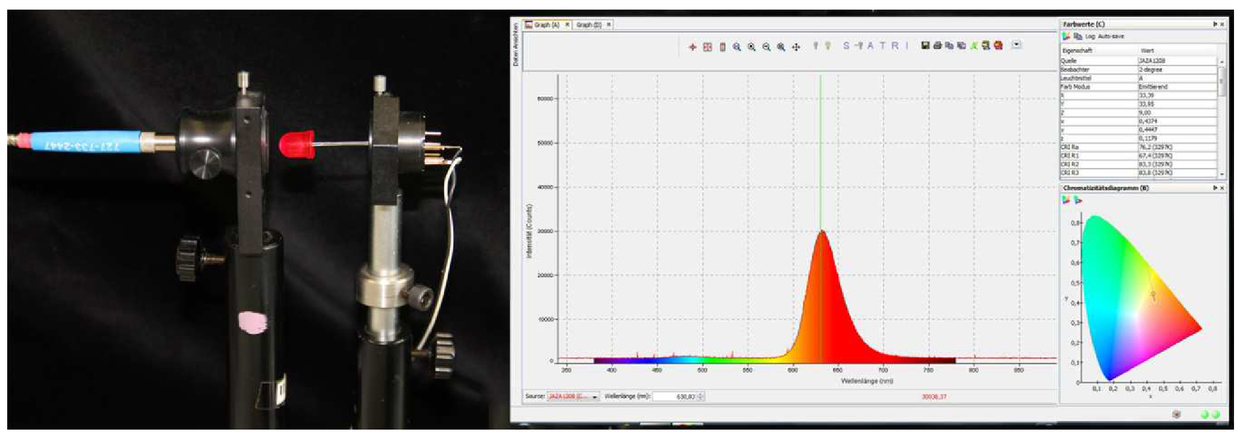
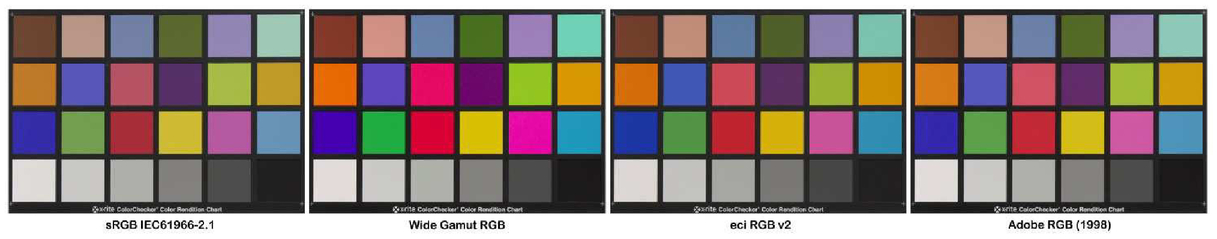
Kirsch, P.,
“Fließlend und lebendig – 125 Jahre Flüssigkristalle: die chemischen Grundlagen der Flachbildschirmtechnologie,”
(2014) http://www.laborundmore.de/archive/104215/125-Jahre-Fluessigkristalle%3A-die-chemischen-Grundlagen-der-Flachbildschirm-Technologie.html Google Scholar
Heckmeier, M., Lüssem, G., Tarumi, K.,
“Flüssigkristalle fur Aktivmatrix-Flachbildschirme,”
(2014) http://www.bunsen.de/bunsen_media/BuMa_2002_05-p-106.pdf Google Scholar
Rogerson, J.,
“Super AMOLED vs. Super LCD: Top Smartphone Screen compared,”
(2014) http://www.techradar.com/news/phone-and-communications/mobile-phones/super-amoled-vs-super-lcd-the-big-screens-compared-1226721 Google Scholar
Nicholas, K.,
“Super AMOLED vs. Retina vs. OLED vs. LCD vs. IPS: Was ist der Unterschied?,”
(2014) http://www.androidpit.de/super-amoled-vs-retina-vs-oled-vs-lcd-vs-ips-was-ist-der-unterschied Google Scholar
Mertens, R.,
“Pentile,”
(2014) http://www.oled-info.com/pentile Google Scholar
Mertens, R.,
“Super AMOLED Plus,”
(2014) http://www.oled-info.com/super-amoled-plus Google Scholar
Soneira, R. M.,
“Smartphone Super LCD-OLED Display Technology Shoot-Out,”
(2014) http://www.displaymate.com/Smartphone_ShootOut_1.htm Google Scholar
Kress, C., Meyrueis, P., Applied Digital Optics, John Wyley & Sons, (2009). https://doi.org/10.1002/9780470022658 Google Scholar
Saleh, B. A. E., Teich, M. C., Grundlagen der Photonik, John Wyley & Sons, (2007). Google Scholar
Vauderwange O., Wielage H.-H., Haiss, U., Dreßler, P., Curicapean, D., “New frontiers in color management by using modern spectrometers,” Paper No. 9289–15, ETP13-ET100-104 (2013) Google Scholar |