|
|
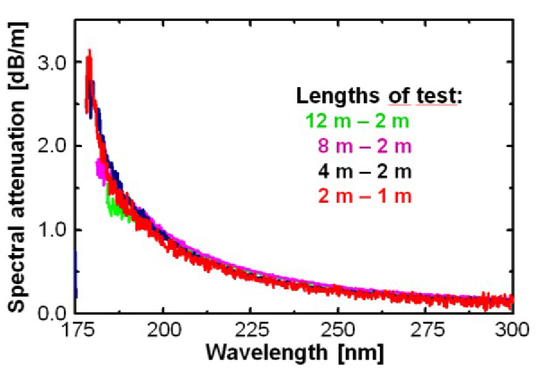
1.INTRODUCTIONThe transmission of light from a light source to a sample and from this sample to a detector via specialty step-index (SI-) fibers is a standard fiber-optic method for medical and spectroscopic applications. Silica-based fibers with a high-OH undoped silica core and fluorine-doped cladding were selected for UV-applications because of lowest attenuation. Presented for the first time in 1974 these fibers have now been commonly used for over 40 years. Around 1985, the interest in deep UV (DUV) applications started due to the introduction of new light-sources and spectral detector-systems. Unfortunately, some restrictions of the UV fibers in these fiber-optic systems became obvious: the life-time or time of operation in fiber-optic based systems were often limited by the generation of optically active defects in this wavelength region. Additionally, material and surface damages with pulsed lasers were observed at UV laser wavelengths. Over the past two decades, UV-properties, such as basic transmission and induced losses have been continuously improved in UV-fibers with a focus on deuterium-lamp usage. These improvements were achieved by preform modifications, novel fiber drawing techniques and fiber processing. Although high-OH fibers seemed most favorable, also low-OH fibers were optimized as wide range fibers for DUV and NIR region, from 200 nm up to 2200 nm wavelength. Details of these improvements leading to 4 generations of different fibers will be shown in following sections. Parallel to improvements in UV fibers, testing equipment and testing methodology were developed and implemented to control quality and reproducibility of the various fiber generations. In addition to fluorescence analysis, several novel UV applications, such as fiber-optic thin-layer chromatography, liquid and gas spectroscopy and other analytical instrumentation will be shown in section 5, only to name a few. Some of these fiber-optic systems for analytical applications use light-sources with light power levels up to 10 mW. 2.STATUS OF UV-FIBERS ARROUND 1990In 1990, silica was the most widely used material for the fabrication of light-guiding fibers in the region spectral between approximately 250 nm and 1.6 μm because of its low attenuation /2,3,4/. Unfortunately, the light transmission below 250 nm was not stable under certain conditions, which were often encountered in sensor systems, where, for example, the light source was a pulsed high-power laser /5,6,7/, an UV-laser /6,7/ or a deuterium lamp /8/. In the latter case, the wide potential spectroscopic applications were restricted to the wavelength region above 250 nm, because standard fibers were damaged by UV-light below 230 nm so quickly that a stable and acceptable transmission in any practical device was impossible. In this section, a short overview about the properties of UV-fibers including their manufacturing is given, based on the knowledge at that time. 2.1Optical properties of UV-fibersFor low-power transmission, only the UV basic attenuation (unit: dB/m) and the UV-induced loss (unit: dB) of a fiber with defined length have to be taken into account. Using (pulsed) laser, the total transmission is additionally reduced by two photon-absorption. 2.1.1Basic attenuationIn the spectral region at λ < 400 nm wavelength, the basic attenuation, αB(λ) in undoped silica or silica fibers with an undoped core, essentially depends on UV-intrinsic losses and on Rayleigh scattering /2,3,4/. Using the standard cut-back method /9/, the difference length AL has to be adjusted to the increasing attenuation values and the decreasing dynamic of the measurement system with decreasing wavelength λ. A typical result is shown in Fig. 1. 2.1.2UV-defects – an overviewOptically active defects in silica or silica fibers can be generated by low-power broadband deuterium-lamps and pulsed excimer-lasers, as summarized in Table 1. Especially the E’-center (=Si•: silicon with one unpaired electron) with an absorption band at 214 nm and the Non-Bridging-Oxygen-Hole center NBOHC (=Si-OH°) at 260 nm are well known in high-OH silica. In addition, Oxygen-Deficient-Centers (ODCs) around 250 nm are observed in low-OH silica. In more detail, overviews on UV-defects can be found in /2,6-8,13-19/. Table 1.Overview about relevant defects and impurities in high OH fibers /13-19/
The concentration of each defect is dependent on several factors, including preform contaminants, preform manufacturing technique and fiber draw process including fiber post-treatments. 2.1.3UV-induced lossesMeasuring UV-induced losses, ΔaL(λ) (unit: dB), the wavelength- and position(z)-dependencies of the UV-induced attenuation, Δα(λ,z), play a significant role. With a low-power broadband DUV light-source, the light-guiding core material will be damaged by generating E’ -centers and/or NBOHCs (see Table 1) by UV-photons with energy hv: In a fiber with a defined length, L, the extent of defect generation decreases along the fiber with position z due to the fact that the fiber behaves as a long pass filter. Therefore, the induced loss, ΔaL(λ), does not increase linearly with the length of the fiber: In addition, the damage is time-dependent, leading to the following equation for the total loss aL,tot with a well-defined fiber length, L, where tUV is the UV-exposure time: 2.2Fiber manufacturingThe above mentioned UV fibers are manufactured in several steps, as shown in Fig. 2. A rod of high-OH synthetic silica is produced by flame-hydrolysis /10,12/ using silicon tetrachloride in an oxygen-hydrogen burner. With Plasma Outside deposition (POD) this rod is cladded with silica having a fluorine content of approx. 3%. The obtained UV-preform has a Cladding-Core-Ratio, CCR, typically in the order of 1.1 or smaller /2,10/. Such performs with diameters > 15 mm are drawn into so-called All-Silica-(AS-)fibers, with core diameters between 50 to 1000 μm. To improve UV optical performance, additional preform and fiber treatments can be carried out. 2.3Fiber testingIn Fig. 3, a principle setup for testing the UV damage of fibers during UV irradiation with a deuterium lamp is shown; this setup was used for confirming the transmission improvements in R&D and for quality control in production. All spectral measurements were performed using a standard deuterium (D2) lamp DO660/05J from Heraeus Noblelight /20/ as a broadband light source and an optimized imaging system. The distal end of the Fiber under Test, FUT, is coupled into a fiber-optic spectrometer (FOS) USB4000 from Ocean Optics /21/ with an UV-enhanced grating for deep-UV used as detector system, DS. Fig. 3:Measurement setup for damaging the UV-fibers with the following components: D2: deuterium lamp; LS: lens system; C. SMA-connector; FuT: fiber under test; UV-FOS: fiber-optic spectrometer with deep UV detection; zF: axial distance between lens system and fiber front face; N2: nitrogen purge, when required  In order to reduce the noise in the FOS-signal and in the UV-induced loss spectra, either an adjacent average with 9 points or a Fast-Fourier-Transformation smoothing filter with cut-off frequency of 0.36 (arb. units) using 15 supporting points were employed. The entire system for measuring the spectral UV-induced losses at room temperature is described in details elsewhere /22-24/. Optionally, a gas-tight box, which can be purged with inert gases, e.g. nitrogen, to avoid oxygen absorption below 195 nm, was used. The position of the shutter, Sh, is controlled by software via an electrical TTL output of a computer. Two cases are distinguished. With an open shutter, the photo-darkening of the FuT with the D2 lamp is measured. During recovery after UV damage, the deuterium irradiation is blocked to avoid additional damage. For each measurement point, however, the shutter is opened for 2 ... 5 s, only; within this short period in comparison to the long period of darkness, the UV damage is negligible /22-24/. The FOS signal, FOSS(λ,t), is proportional to the spectral power densities, at a given wavelength. However, the transfer factor from input power or density to photo current or charge is strongly wavelength dependent. The spectral and temporal UV-induced losses (unit: dB) can be determined as follows: Either, the spectral losses ΔaL(λ,ti) at given times ti or the temporal losses ΔaL(λn,tUV) at given wavelengths λ, are determined. 3.UV FIBER IMPROVEMENTS3.1UV fibers with high-OH silica coreIn 1993, standard UV fibers (type: FVP /11/; 1st generation) drawn from standard UV preforms /10/ had a very low basic attenuation, with values of < 1.0 dB/m at 200 nm (see Fig. 1). However, these fibers were darkened below 230 nm during UV irradiation with deuterium lamps within 11 h (Fig. 4); the UV induced losses at 214 nm of such 1 m long fibers were between 10 to 40 dB, depending on different manufacturing and testing parameters (Fig. 5). In addition to the high values, the recovery of the fiber was an issue, too: the concentration of transient E’-centers was decreasing with time constants of several hours. Fig. 4:Wavelength-dependent transmission, expressed by photocurrent, before and after 11 h of UV-irradiation of a 1.0 m long UV-fiber of 1st generation; the darkening below 230 nm is due to the generation of E ‘-centers /25/  Fig. 5:Saturated UV-induced loss after (only) 4 h of UV-irradiation, using UV-fibers from the same draw and a stronger deuterium-lamp; the different graphs are generated with different input conditions /8,24/ 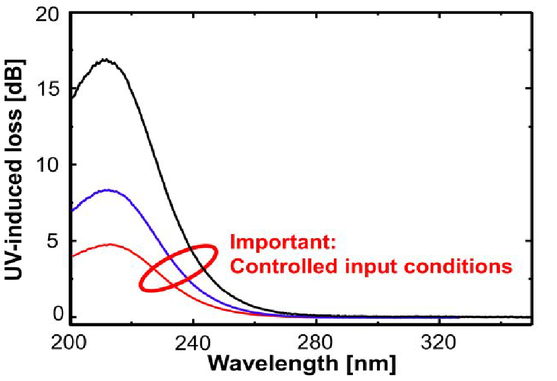 The stimulating step was the hydrogen-loading of the standard UV fibers (type: UVI; 2nd generation), described in /25/ for the first time. The E’-centers generated by UV-light (see eq. 1) were passivated as follows: Comparing with Fig. 4, these fibers exhibit no UV-induced losses within 11 h of UV-irradiation (Fig. 6). Testing three different fiber samples, the same behavior was confirmed for 11 hours (Fig. 7). Only small differences were observed in the short-term behavior because the precursor and defect concentrations could have been different due to processing of preform and fiber. In addition, similar improvements were found with KrF-laser irradiations (Fig. 8). Fig. 6:Wavelength-dependent transmission, expressed by photocurrent, before and after 11 h of UV-irradiation of a 1.0 m long UV-fiber of 2nd generation; the darkening below 230 nm is avoided due to hydrogen-content in the light-guiding core /25/  Fig. 7:Comparison of the UV-damages of 1.0m long UV-fibers from 1st generation (1 piece) and 2nd generation (three samples) using deuterium-lamp, described by the temporal transmission at 214 nm wavelength (maximum of E’ -center absorption) for 1.0 m long UV-fibers; the defects generated by UV-light and the passivation with hydrogen is indicated /25/  Fig. 8:like Fig. 7, however the fiber is damaged by a KrF-laser (248 nm) and transmission is monitored at 248 nm, too /25/  This first step of improvement enabled several new applications where DUV light was required. However, for many applications using small fiber diameters the predicted life-time due to hydrogen out-gassing was not sufficient /26-29/. Because of an increased demands for non-loaded fibers, the preform manufacturing process was modified and a new product was announced in 1999 /30,31/. Using this modified preform without any significant changes in the drawing process, the 3rd generation of UV fiber became commercially available /10,11/. However, transient defects were still too high leading to signal drifts and uncertainties in the application set-ups. Finally, additional changes in fiber-drawing and post-treatments lead to a further improved fiber (4th generation) with lowest permanent and transient defect concentrations /32/, using the proposed 4 h test described in section 2.3. Over several design generations, the UV damage at 214 nm wavelength of high-OH fibers has been reduced significantly. These steps and the increased UV-stability are shown in Fig. 9 and Table 2. Fig. 9:Comparison of the different hydrogen-free fibers in respect to the spectral UV-induced loss after UV-irradiation of 4 hours (saturation); the fiber lengths are different: 1 m for FVP, 2 m for FVP-UVM and FDP  Table 1.History of different high-OH fibers with reduction of UV-induced losses at 214 nm
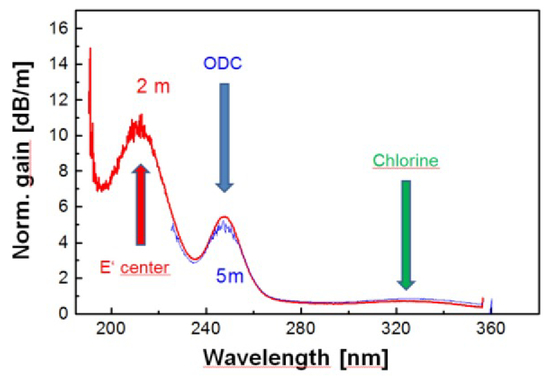
Focusing on the two main defect centers, Fig. 10 shows the temporal damage of a commercially available FDP-fiber (4th generation) with 100 μm core diameter. In the proposed 4 h test (section 2.3), the UV-induced loss at 214 or 266 nm loss in a 2 m fiber sample will be below 0.8 dB or 0.3 dB, respectively. Starting with the FVP-fiber (1st generation), the normalized transmission at 214 nm wavelength increased from 0.1 % to > 90 % for the FDP-fiber. However, a longer UV test of 48 hours was carried out leading to an additional increase of 214 nm absorption band after a first saturation (around 4 hours), as shown in Fig. 11 /33/. For 260 nm band, on the other hand, it is obvious that no saturation can be observed. After 48 hours, both absorption bands seemed to have the same value due to different rates of increases: Fig. 10:Temporal UV-induced loss of 2 m long FDP-fibers (4th generation) samples having <90 pi m and 100 μm core diameter, shown for 214 nm (E’-center) and 266 nm (NBOHC)  Further improvements lead to the newest results, shown in Fig. 12. Now, both absorption bands are nearly constant for at least 72 hours or 3 days of continuous UV-irradiation with a deuterium-lamp. These newest results were published in /34,35/. In addition, the optical UV properties can be determined leading to a certified UV-fiber /11,36/, using the described measurement set-up above. 3.2UV fibers with low-OH silica coreOn first view /37/, high-OH fibers seemed to be favorite for DUV applications. As seen in Fig.13, the basic attenuation is very high, especially around 214 and 250 nm. These drops in transmission are related to the well-known E’-centers and Oxygen Deficient Centers (ODC) in low-OH material. Fig. 13:Spectral transmission due to basic attenuation in low-OH SI-fibers with 200 μm core diameter; E ‘-centers at 214 nm and Oxygen Deficient Centers (ODC) at 250 nm are dominant /37/  Similar to the improvement from 1st to 2nd generation of high-OH, hydrogen loading will increase the basic UV transmission per meter or reduce the basic UV attenuation significantly (Fig. 14). The gain in attenuation for this selected sample of a low-OH fiber with 600 μm core diameter was: > 10.0 dB/m at 214 nm and > 5.0 dB/m at 250 nm (Fig. 15). A slight decrease in attenuation at 330 nm due to chlorine modifications is obvious, too. The overall output power in dependence of the wavelength or the spectral attenuation is very similar for low-OH and high-OH fibers. As discussed in /37/, however, the starting performance of the low-OH fiber has a strong influence on the final one, after hydrogen loading. In some cases, the ODCs could not be suppressed totally. Further processing steps have been added leading to a hydrogen-free low-OH fiber with excellent IR-performance and excellent UV-stability (Fig. 16). The final product FBPI /11,3 8/ is used in several new applications, e.g. in astronomy. Fig. 16:Spectral UV-damage of broadband low-OH fiber after 4 h UV-irradiation with deuterium-lamp /38/  4.NEW UV LIGHT-SOURCES AND FIBER-DAMAGEThe damage of UV-fibers has mainly been studied with broadband low-power deuterium-lamps and pulsed excimer-lasers. In the last 5 years, however, new and reasonably priced UV light-sources with interesting features became commercially available: In Fig. 17, the (relative) spectral output power out of a 100 μm core is shown using three UV light sources under test and a deuterium-lamp as a reference /33,43/. As shown, the power levels are significantly higher compared to the deuterium lamp: especially, the integration time for the deuterium-lamp was at least 2 magnitudes of order higher. Fig. 17:The spectral output power of new commercially available UV Light-sources, measured with a 100 μm core fiber; in addition to two pulsed Nd-YAG-lasers with 266 and 355 nm wavelength /33,42,43/, a Laser-driven broadband (plasma) lightsource (LDLS, /39/) has been used, which is continuously (cw) irradiating  The surprising results for the laser-driven plasma lamp LDLS are shown in Fig. 18 & 19 /33/. After a sharp increase of the typical absorption bands at 214 and 265 nm, the maximum of 1.75 dB is reached after approx. 1 min. Although the spectral power in the fiber was at least 20 dB higher, significant annealing took place leading to a saturation level of 0.7 dB due to photo-bleaching with strong IR-light /44/; with the same fiber, the saturated induced loss at 214 nm was 2.5 dB using the standard set-up with deuterium-lamp as a reference. Focusing on 265 nm, no saturation is obvious after 4.0 hours of LDLS irradiation. Fig. 18:Temporal UV-induced loss of 2 m long FDP-fibers (4th generation) samples having 100 μm core diameter, using the new LDLS /39/; similar data after 4 h tests with deuterium-lamp is included in the figure; the absorption around 250 and 266 nm is not in saturation, after 4 h tests  Fig 19:Spectral UV-induced loss of 2 m long FDP-fiber (4t generation) samples having 100 μm core diameter, using the new LDLS /39/; a strong local maximum at 214 nm is shown within less than 5 minutes followed by a reduction at 214 nm and an increase at 265 nm after 4 h UV-irradiation with new plasma-lamp  Using pulsed 3rd harmonic Nd-YAG-laser /33/ with very high pulse power, the UV-induced damages are significantly higher (Fig. 20), in comparison to the deuterium lamp after 4 hours. With increasing pulse energies, the 260 nm absorption (NBOHC, see table 1) is growing stronger indicating that additional effects appear. In order to understand these effects more clearly, further tests are planned. 5.FIBER-OPTIC APPLICATIONS IN UV REGIONAs indicated before, UV-applications have been stimulated by further improvements of UV-fibers. Although the hydrogen-loaded UV-fibers of the second generation are not widely used, especially for small diameters, these fibers were door-openers for new fiber-optic UV applications, as follows: 5.1Liquid-Core- Waveguides and flow cellsSome time ago, Liquid-Core-Waveguides (LCW) and flow cells (FC) for UV applications were studied in detail. Using Teflon on the outer side of a silica capillary, a light-guiding waveguide can be built up with all liquids in the capillary bore as long as the refractive index is higher than that one of Teflon /49,66/. In Fig. 21 an optical fiber based flow cell is shown /51/. Using the well-known Lambert-Beer’s law, the effective path length in the LCWs or FC is smaller than the distance (physical path length) between the two optical fibers due to the partial propagation of light in the non-absorbing silica tube (see lcap in Fig. 21). This issue was discussed in detail in several papers (see /51/). Fig. 21:Sketch of a fiber-coupled Liquid-Core-Wave-guide (LCW) or flow cell; due to total reflection at the Teflon-coating, some portion of the light is propagating in the non-absorbing silica capillary /49,51/  Some examples of spectral absorption measurements are given, for acetone (Fig. 22) and toluene (Fig. 24) with different concentrations in pure water. As expected, the absorption of acetone at the maximum absorption at 266 nm is linearly increasing with the concentrations, in the range from 20 mg/l to 300 mg/l (Fig. 23). Above that level, saturation is obvious caused by the dynamic range of the measurement set-up. 5.2Hollow-Core- Waveguides for gas analysesWith a similar set-up, gas absorption can be measured in the UV-region (Fig. 25). Using short-length fibers, the possible wavelength region can reach 185 nm and below easily; however, the dynamic range is decreasing with decreasing wavelength, mainly caused by stray light effects in the polychromatic detector and in the application. As shown in Fig. 24, the different gases have specific structures in their absorption spectra: the UV “finger-print” of the gas under test. Only ethanol has a non-specific spectrum with only broad absorption band. More details are in /52-54/. Fig. 25:Overview about fiber-coupled set-up for measuring gas absorption with long-length Hollow-Core- Waveguides (HCW, /67/) in the UV-region  5.3Diode-array (DA) Thin-Layer-Chromatography (TLC)The last example of our selection is the spectral Thin-Layer-Chromatography in the UV-region with diode-array which can only be realized with fiber-optic bundles /45-47/.The separation technique itself including the preparation will not be explained in this paper; details are in /48/. In Fig. 27, the principle set-up for spectral TLC with fiber-optics is shown: without any analyte (a) on the plate the light from the “emission fiber” will be reflect and/or re-emitted from the surface layer and collected by the “detection fiber”. The numerical aperture and the distance to the plate are the key parameters for the light coupled between the two fibers /46,47/. With analytes (b), the measured spectrum will be changed by the spectral absorption losses in the analytes. For the first time on a TLC-plate, fluorescence can be used for analyses, too. In mode A (c), the fluorescence of the analyte will be collected directly by the “detector fiber”. However, having a fluorescent layer on the plate, this emission light can be modulated by the analyte due to absorption, as seen in mode B (d). Fig. 26:Examples of absorption spectra of acetone, nitric oxide, ammonia, ethanol and oxygen, measured in a 1 m long HCW /52-54/  Fig. 27:Fiber-optic Thin-Layer-Chromatography; principle light-path and emission and acceptance cones of moving fibers (a), absorption mode with absorbing analyte on the plate (b), fluorescence mode A with fluorescent analyte (c) and fluorescence mode B with additional fluorescent layer on the plate plus an absorbing analyte (d) 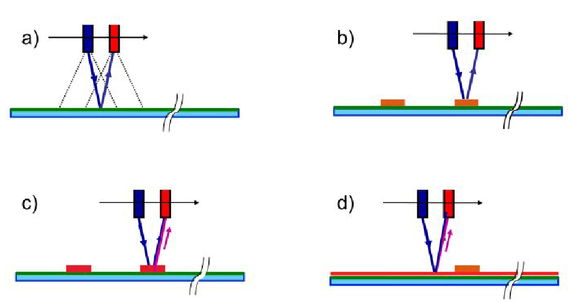 In Fig. 28, the difference spectrum (in dB) of an absorbing and fluorescent analyte is shown. For positive sign, the light is attenuated due to absorption; for negative sign, the measured signal is higher due to additional fluorescence. As an example, spectral TLC with fiber-optics is capable to distinguish between 16 Polycyclic Aromatic Hydrocarbon (PAHs); using absorption and fluorescence. In addition, the positions of the separation are different (Fig. 29). While only one PAH can be detected easily by fluorescence, 5 PAHs will be optically separated using absorption spectra only. 6.SUMMARY AND OUTLOOKUV-damages in silica based UV-fibers have been significantly reduced over the last two decades. Although no solarization-free material has been found so far, the achieved induced losses of < 0.6 dB at 214 nm and < 0.3 dB at 265 nm for 2 m long hydrogen-free fibers with 200 μm core are very impressive. Transient defects, mainly problematic in applications, such as e.g. UV-VIS HPLC detectors, where constant light delivery in the 200 to 250 nm is essential for baseline stability, are extremely low. In addition, the basic attenuation below 200 nm can be guaranteed. As a result, certified UV-fibers including both parameters are commercially available. It is obvious that the relevant measurement techniques were required to detect and prove these improvements. In a first step, a system to measure UV attenuation at 190 nm wavelength and below was designed, using the cut-back method. However, the most important innovation was a measurement system for spectral and temporal UV-damage, where UV damages were split into permanent and transient components. It turned out that a low-power broadband deuterium-lamp was an excellent light-source for these requirements. However, the coupling conditions of the light beam into the fiber had to be optimized to get highest UV-damage levels. The next step will be the standardization of this measurement technique for optical degradation of UV-fibers. Taking the above mentioned results (section 2.3) into account, a first draft will be proposed by the German Institute for Standardization (DIN) “Fiber optics” within this year. A multitude of fiber-optic UV applications have been mentioned. Based on novel UV light-sources, new UV applications were and will be stimulated. A small selection of these for us very interesting applications has been described in more detail above. These applications appear to have the potential for a commercial success in the near future, although they have been studied in R&D for more than one decade. The temporal and spectral behavior of UV-light induced defects in silica was found to be very different, using high-power broadband plasma source, LDLS, or pulsed UV-lasers. On one side, significant annealing in addition to defect generation was observed, due to NIR-light of such LDLS. Future work will concentrate on the photobleaching effect, varying the spectral power above 400 nm in the fiber. On the other hand, UV-damage at 214 nm & 260 nm including a tail into the longer wavelength region was found to be significantly higher with UV-lasers than with low power deuterium lamp sources. As these effects are not totally understood, further experimental data will be collected with such lasers, in the near future. After more than two decades, there are still open questions about the damaging mechanism of UV light in UV-fibers with undoped silica core and F-doped cladding. As an outlook, current and future applications will generate a multitude of new R&D-projects to study and further improve the properties of fibers and fiber-optic systems. 7.ACKNOWLEDGEMENTDuring more than two decades, there are many people involved in these improvements. Therefore, we would like to thank John Shannon, Rick Timmerman, Jim Clarkin & Gary Nelson (Polymicro Technologies, Phoenix) for supporting these activities from the beginning. In addition, we are in debt to Paul Lemaire (former: AT&T Bell labs, Murray Hill) Johannes Kirchhoff, Sonja Unger & Stefan Grimm (IPHT Jena) for loading the first fibers and to Mathias Belz (World Precision Instruments, Sarasota) for fruitful discussions in respect to fiber-optic spectrometers and new applications plus reviewing the manuscript. In addition, we acknowledge the support by G. Schötz, A. Langner (Heraeus Quarzglas, Hanau) due to preform delivery with improved quality, by H. Zimmermann & S. Preis (Crylas, Berlin) for improved laser supplies, by J. Mannhardt and H. Meyer (J&M, Aalen) and W. Neumann (Consultant) for the fruitful discussions in respect to fiber-optic spectrometers and new applications. From academic side, we thank G. Hillrichs (Hochschule Merseburg) and B. Spangenberg (Hochschule Offenburg) for their theoretical and experimental support. At the moment, the German standardization (DIN) group “fiber-optics” is supporting these activities with the following members: S. Suess (head; Schott, Mainz), G. Kuka (Fiberware, Mittweida), M. Landis & H. Huth (j-fibers). And finally, we would like to thank all THM students & THM alumni, especially J. Assmus, M. Huebner, C. Jakob, C. Gonschior, H.S. Eckhardt and H. Praetorius for their contributions to the experimental results. 8.8.REFERENCESK.Rau, A.Mühlich, N.Treber, : “Progress in silica fibers with fluorine dopant”. Proc. OFC 1977, paper TuC4 (Williamsburg, 1977) Google Scholar K.-F.Klein,A.Mühlich, VDI-Berichte 673, 147
–177 Karlsruhe,1988). Google Scholar
W.Heitmann,
“Attenuation analysis of silica-based single-mode fibres,”
J. Opt. Comun. 11,, 122
–124
(1990). Google Scholar
G.H.Sigel jr.,
“UV spectra in silicate glasses,”
J.-Non-Cryst.Solids, 13 372
–398 https://doi.org/10.1016/0022-3093(74)90002-7 Google Scholar
R. H. Stolen,, Non-linear properties of optical fibres”, in Optical Fiber Communications, Acad, 125ff Press, New York
(1979). Google Scholar
K.-F.Klein,G.Hillrichs,P.Karlitschek,K.Mann, : “Possibilities and limits of optical fibers for the transmission of excimer laser radiation”. SPIE-Proc. Vol.2966 „Annual Boulder Damage Symposium”, S.564–573 (Boulder, Oct. 1996) Google Scholar P. Karlitschek, G. Hillrichs, K.-F. Klein,
“Photodegradation and nonlinear effects in optical fibres introduced by pulsed UV-laser radiation,”
Opt. Comm. 116,, Google Scholar
H. Fabian, U. Grzesik, K.H. Worner and K.-F. Klein,
“Optical fibre for UV-applications,”
Google Scholar
D. Marcuse, Academic Press Inc., New York1981). Google Scholar
:Heraeus Quarzglas, Hanau (Germany), Brochures about Suprasil™ and Fluosil™, www.heraeus.com Google Scholar
:Polymicro Technologies, Phoenix (USA), Data sheets about All-Silica Fibers, www.polymicro.com Google Scholar
T. Li,, Optical fiber communications: Volume 1 Fiber Fabrication, Academic Press,
(1985). Google Scholar
D.L.Griscom,
“„Defect structures of glasses,”
J.Non-Cryst. Solids., 73 51
–78
(1985). https://doi.org/10.1016/0022-3093(85)90337-0 Google Scholar
E.J.Friebele, D.L.Griscom,
“Radiation effects in glassTreatise on material science and technology,”
Acad.Press, New York, 257
–351
(1979). Google Scholar
E.J.Friebele,,
“Overview about Radiation Effects in Fiber Optics,”
SPIE-proc. 541, 70
(1985). https://doi.org/10.1117/12.975360 Google Scholar
R.A.Weeks,
“The many varieties of E’-centers: a review,”
J.-Non-Cryst.Solids, 179 1
–9
(1994). https://doi.org/10.1016/0022-3093(94)90680-7 Google Scholar
L.Skuja,
“Optically active oxygen-deficiency-related centers in amorphous silicon dioxide,”
J.-Non-Cryst.Solids, 239 16
–48
(1998). https://doi.org/10.1016/S0022-3093(98)00720-0 Google Scholar
V.Kh.Khalilov, G.A.Dorfman, E.B.Danilov, M.I.Guskov, V.E.Ermakov,
“Character, mechanism of formation and transformation point defects in type IV silica glass,”
J.-Non-Cryst.Solids, 169 15
–28
(1994). https://doi.org/10.1016/0022-3093(94)90220-8 Google Scholar
R.West, SPIE-Proc., 867 2
–9 Cannes, France)1987). https://doi.org/10.1117/12.965056 Google Scholar
Heraeus Noblelight, Hanau (Germany), Brochure about standard deuterium lamps and Fiberlight, Google Scholar
Ocean Optics, Dunedin, FL (US),
“Data sheet about fiber-optic spectrometer and assemblies,”
Google Scholar
M. Huebner, H. Meyer, K.-F. Klein, G. Hillrichs, M. Ruetting, M. Veidemanis, B. Spangenberg, J. Clarkin, G. Nelson, SPIE-Proc. BiOS’00, 3911 303
–312 San Jose,2000). https://doi.org/10.1117/12.384918 Google Scholar
K.-F. Klein, R.Arndt, G. Hillrichs, M. Ruetting, M.Veidemanis, R.Dreiskemper, J. Clarkin, G. Nelson, : „UV-fibers for applications below 200 nm”. SPIE-Proc. BiOS’01, Vol. 4253, pp. 42–49 (San Jose, Jan.01) Google Scholar K.-F.Klein, C.P.Gonschior, D.Beer, H.S.Eckhardt, M.Belz, J.Shannon, VK Khalilov, MB Klein, C.Jakob, : “Silica-based UV-fibers for DUV applications: current status (Invited Paper)”. SPIE-Proc. Vol. 8775, paper 8775–10 (Prague April 2013) Google Scholar K.F.Klein,P.Schliessmann,E.Smolka,M.Belz,W.J.O.Boyle,K.T.V.Grattan,
“UV-stabilized silica based fiber for application around 200 nm wavelength,”
Sensors and Actuators B, 38-39 305
–309
(1997). https://doi.org/10.1016/S0925-4005(97)80224-9 Google Scholar
K.-F.Klein, R.Kaminski,S.Hüttel, J.Kirchhof, S.Grimm, G.Nelson, SPIE-Proc., 3262C
(BiOS’98), 150
–160 San Jose,1998). https://doi.org/10.1117/12.309468 Google Scholar
R.W.Lee,
“Diffusion coefficient of hydrogen in silica,”
J.Chem.Phys., 36 1062ff
(1962). https://doi.org/10.1063/1.1732632 Google Scholar
J. Kirchhof, P.Kleinert, W. Radloff, E.Below,
“„Diffusion processes in lightguide materials,”
Status solidi (a), 101 391
–401
(1987). https://doi.org/10.1002/(ISSN)1521-396X Google Scholar
J.Stone,
“Interactions of Hydrogen and Deuterium with Silica Optical Fibers: A Review,”
IEEE J.Lightw.Techn., LT-5 712
–733
(1987). https://doi.org/10.1109/JLT.1987.1075562 Google Scholar
H.Fabian,U.Grzesik,G.Hillrichs,W.Neu,
“Optical fibers with enhanced performance for excimer laser power transmission at 308 nm,”
in Los Angeles,
24
–28 Google Scholar
J.Vydra,G.Schötz, : „Improved all-silica fibers for deep UV-applications”. SPIE-Proc. Vol. 3596 (BiOS’99), paper 3596–25 (San Jose, Jan. 1999) Google Scholar V.Kh.Khalilov, K.-F.Klein, J.Belmahdi, R.Timmerman, G. Nelson, : “High-OH fibers with higher stability in the UV-region”. SPIE-Proc. BiOS’06, Vol. 6083, paper 6083–08 (San Jose, USA, Jan.06) Google Scholar J. Heimann, K,-F. Klein, C.P. Gonschior, M. Klein, G. Hillrichs,, “Optical fibers for 355 nm pulsed lasers and high-power broadband light sources”, SPIE Proc., Vol. 8576, paper 8576–19, 2013J. Heimann, K,-F. Klein, C.P. Gonschior, M. Klein, G. Hillrichs,, “Optical fibers for 355 nm pulsed lasers and high-power broadband light sources”, SPIE Proc., Vol. 8576, paper 8576–19, 2013 V. Khalilov, J.Shannon, R.Timmerman, : “Improved Deep UV Fiber for Medical and Spectroscopy Applications”, SPIE-Proc. BiOS’15, Vol. 8938, paper 8938–9 (San Francisco, USA, Feb.14)V. Khalilov, J.Shannon, R.Timmerman, : “Improved Deep UV Fiber for Medical and Spectroscopy Applications”, SPIE-Proc. BiOS’15, Vol. 8938, paper 8938–9 (San Francisco, USA, Feb.14) V. Khalilov, J.Shannon, R.Timmerman, D. Geshell, : “Improved Deep UV Fiber for Medical and Spectroscopy Applications”, SPIE-Proc. BiOS’15, Vol. 9317, paper 9317–14 (San Francisco, USA, Feb.15) Google Scholar TransMIT GmbH, Giessen (Germany),
“Data sheet about certified UV-fibers,”
(2010). Google Scholar
J.Assmus, J.Gombert, K.-F.Klein, G. Nelson,J.Clarkin,
“„Improvements in UV transmission of all-silica optical fibers with low-OH content,”
in San Jose,
108
–114 https://doi.org/10.1117/12.346707 Google Scholar
V.Kh.Khalilov, K.-F.Klein, G.Nelson, : “Low-OH all-silica fiber with broadband transparency and radiation resistance in the UV-region”. SPIE-Proc. BiOS’04, Vol. 5317, paper 5317–9 (San Jose, Jan.04) Google Scholar : “Energetiq, Woburn (USA), Data sheets about Laser-Driven Light-Source,”
www.energetiq.com Google Scholar
E.F.Schubert, H.W.Yao (chairmen),
in San Jose,
Google Scholar
Nichia Corp.: Nichia Corp., Data sheet about UV-LEDs, STSE - CC5008A, Google Scholar
CryLas, Berlin (Germany), Brochure about low-power Nd:YAG-lasers for UV-applications, Google Scholar
T. Tobisch, H. Ohlmeyer, H.Zimmermann, S.Prein, J.Kirchhof, S.Unger, K.-F.Klein, : „ Improvement of specialty fiber damage at 266 nm wavelength”, SPIE Proc., Vol. 8938, paper 8938–14, 2014 Google Scholar E.J.Friebele, M.E.Gingerich,
“Photobleaching Effects in Optical Fiber Waveguides,”
3448 https://doi.org/10.1364/AO.20.003448 Google Scholar
K.-F.Klein, B. Spangenberg, H.Meyer, J.Mannhardt, J.Macomber, : „New analytical applications with UV-fiber bundles”. SPIE-Proc. BiOS’01, Vol. 4253, pp.168–175 (San Jose, Jan.01) Google Scholar K.-F. Klein, B. Spangenberg, B. Ahrenz, : “Fluorescence in the fiber-optic HPTLC-method”. SPIE-Proc. BiOS’02, Vol. 4616, paper 4616–30 (San Jose, Jan.02) Google Scholar B.Spangenberg, K.-F.Klein, J. Mannhardt, : „High Performance Thin Layer Chromatography using Fiber-Optics and Diode-Array Detection”. SPIE-Proc. BiOS’02, Vol. 4625, paper 4625–24 (San Jose, Jan.02) Google Scholar B.Spangenberg, C.Poole, C.Weins,
“Quantitative Thin-Layer Chromatography: A Practical Survey,”
Springer,
(2011). Google Scholar
(WPI Inc. Sarasota: Data sheets about flow cells, www.wpiinc.com Google Scholar
:J&M Analytik AG, Essingen (Germany), Data sheets about Fiber-Optic Spectrometer, www.j-m.de Google Scholar
J.Werner, M.Belz, K.-F.Klein, : “UV and VIS far field intensity profile of optical fiber based flow cells”, SPIE Proc., Vol. 9317, paper 9317–9, 2015 Google Scholar H.-S. Eckhardt, L. Lagesson-Andrasko, V. Lagesson, K.-F. Klein, K.T.V.Grattan, : “Towards a fiber-optic detection device for GC-UV”. Proc. of “29th international symposium on capillary chromatography” and “3rd GCxGC symposium” (Riva, Italy, May-June 2006)H.-S. Eckhardt, L. Lagesson-Andrasko, V. Lagesson, K.-F. Klein, K.T.V.Grattan, : “Towards a fiber-optic detection device for GC-UV”. Proc. of “29th international symposium on capillary chromatography” and “3rd GCxGC symposium” (Riva, Italy, May-June 2006) L.Lagesson-Andrasko, V.Lagesson,
“Handbook of ultraviolet spectra: Vapor phase 163 to 330 nm,”
Google Scholar
H.-S. Eckhardt, K.Graubner, K.-F. Klein,T.Sun, K.T.V.Grattan, : “Fiber-optic based gas sensing in the UV region” SPIE-Proc. BiOS’05, Vol. 6083, paper 6083–35 (San Jose, USA, Jan.06) Google Scholar G.Marowsky,F.Lewitzka,P.Karlitschek,U.Bünting,M.Niederkrueger,
“Miniaturized laser-induced fluorescence system with fiber optic probe for the analysis of acromatic compounds,”
in Boston,
2
–9 https://doi.org/10.1117/12.333734 Google Scholar
P. Karlitschek,,
“Fiber-optic studies related to UV-laser-based sensor for pollutants (in German),,”
ISBN-10: 3895888281, Cuvillier publisher, Goettingen,
(1998). Google Scholar
M.Koehler, H.Dietz, Y.Maatsuura, M.Miyagi,K.-F.Klein, G.Hillrichs, : Status and improvements of the UV laser scalpel”, SPIE-Proc., Vol. 4717 (BiOS’97), paper 4717–12 (SanJose, February 2003) Google Scholar K.F.Klein,L.S.Greek,H.G.Schulze,M.W.Blades,C.A.Haynes,R.F.B.Turner, : „Fiber-guided tunable UV-laserlight system around 215 nm”. SPIE-Proc., Vol. 2977 (BiOS’97), paper 2977–14 (SanJose, February 1997) Google Scholar H.G.Schulze, C.J.Barbosa, L.S.Greek, R.F.B.Turner, .A.Haynes, K.-F.Klein, M.W.Blades,
“Advances in fiber-optic based UV resonance Raman spectroscopy techniques for anatomical and physiological investigations,”
in San Jose,
157
–167 Google Scholar
H.G.Schulze,L.S.Greek,M.W.Blades,A.V.Bree,B.B.Gorzalka,K.-F.Klein,R.F.B.Turner, : “Development of optical fiber sensor probes for rapid remote in-situ spectroscopic measurements of biological samples”. SPIE-Proc. BiOS97, paper 2982–28 (San Jose, Feb. 1997) Google Scholar L.S.Greek, H.G.Schulze, M.W.Blades,C.A.Haynes,R.F.B.Turner, : “In-situ investigation of protein and DNA structure using UVRRS”. SPIE-Proc. BiOS97, paper 2982–17 (San Jose, Feb. 1997) Google Scholar E. Takala,
“”Silica-Silica Polimide Buffered Optical Fiber Irradiation and Strength Experiment at Cryogenic Temperatures for 355 nm Pulsed Lasers,,”
Cryogenics, 52 77
–81
(2011). https://doi.org/10.1016/j.cryogenics.2011.09.010 Google Scholar
E.Takala,
“The Laser quenching technique for studying the magneto-thermal instability in high critical current density superconduction strands for accelerator magnets,”
ISBN 978-951-29-5128-4, PhD-thesis, University of Turku, Google Scholar
J.C. Heimann, C P. Gonschior, K.-F. Klein, G. Hillrichs, E, Takala,,
“Spectral UV losses in 355 nm pulsed laser delivery system at low temperatures,”
J.Non-Cryst. Solids, 376 43
–49
(2013). https://doi.org/10.1016/j.jnoncrysol.2013.04.042 Google Scholar
M.Belz, H.-S.Eckhardt, C.P. Gonschior, G.Nelson, K.-F.Klein, : “Quality control of UV resistant fibers for 200–300 nm spectroscopic applications”. SPIE-Proc.Vol. 6852 (BiOS 08), paper 6852–33 (San Jose, Jan. 2008) Google Scholar K.-F.Klein, M.Belz, Dress, Franke, Boyle, KTV Grattan,
“”Ultra-sensitive detection system for fiber optic based UV spectroscopy,”
in San Jose,
3258
–11 Google Scholar
Y. Matsuura, M. Miyagi, ; “Aluminum-coated hollow glass fibers for ArF excimer laser light fabricated by metalorganic chemical -vapor deposition”, Appl. Opt. 38, 2458 (1999) Google Scholar |