|
|
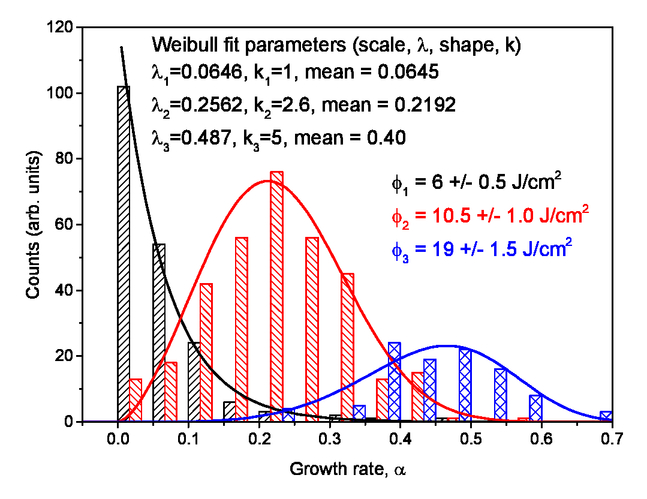
I.IntroductionEarly operation of large-aperture high-energy UV lasers was made more difficult by laser-induced damage1-4, especially on the large SiO2 optics. In recent decades quality of finishes on SiO2 optics has improved to the point where damage on the largest of such optics approaches the exception, rather than the norm5-7. Because individual sites are now relatively rare, it becomes extremely important to understand how each damage site will evolve over time8-12. This is particularly true in the case of Inertial Confinement Fusion (ICF) lasers such as the National Ignition Facility (NIF, US), the Laser Mega-Joule (LMJ, France) and the SG-III laser facility (China). The ability to accurately predict growth behavior of damage sites will always be important to these types of facilities because as optics become more robust the systems will inevitably run at higher fluence to achieve higher energy densities on target and hence likely to result in at least some induced damage sites. For solid state laser systems with pulse durations of a few ns, initiated damage sites are typically not more than a few tens of microns in diameter11. If the damage sites remained their original sizes, their relatively small numbers on modern optics would have no impact on laser operation. Hence it becomes extremely important to study and understand the growth behavior of such damage sites under the conditions present in ICF-class lasers. The primary strategy for managing damage growth has been damage site mitigation to arrest its evolution on subsequent laser exposures1, 11, 13-18. The success of repairing a growing damage site depends on implementing the repair of the site before it exceeds some maximum size which is achieved by early removal of the damaged optic from its host laser system. On the other hand, leaving an optic installed for as long as possible reduces the total number of optics used, the manpower to handle them, and laser down-time and hence the cost of operating the laser. Balancing these two conflicting priorities is facilitated by an accurate prediction of when each optic will need to be removed to repair its damage sites. In this work we review the laser parameters which govern damage growth rates and consider the morphological features of sites which affect the uncertainty in predicting their evolution. Moreover, we show that the correct application of statistics can predict the aggregate behavior of populations of sites and how knowledge of site morphology can improve predictions for individual sites. Historically, growth was described by the increase in diameter of a damage site as a function of laser fluence (ϕ)19-23 When a site is uniformly illuminated (i.e., by beam area large compared to the site) with pulses of a few ns in duration, growth is observed to be exponential with shot number for damage on the exit surface of SiO2 optics. This is in contrast to the hole-drilling geometry, where the damage site is of comparable size to that of the laser beam and the increase in diameter is closer to linear with shot number. The work discussed here, both historic and novel will consist exclusively of damage studied under fluence flooded conditions on the exit surface of SiO2 optics. The previous studies of damage growth using large area beams involved measurements of the diameter of a single site after each shot in a sequence of a large (in the context of ICF lasers) number of laser shots. Figure 1 shows the diameter of a laser-induced damage site and the 3ω fluence it was exposed to for 70 laser pulses at a fixed targeted fluence. The shot to shot variation in the laser fluence is due to fluctuations in the laser output. The rate at which the site grows is defined by where d0 and dn are the diameters of the site before the first shot and after the nth shot, respectively. The single fitting parameter α is typically called the growth rate or growth coefficient. Figure 1Laser fluence at 355-nm (3ω) and site diameter after each of 70 exposures. The fit to the diameter data is based on Eq. (1). The fitting parameter α, is equal to 0.041 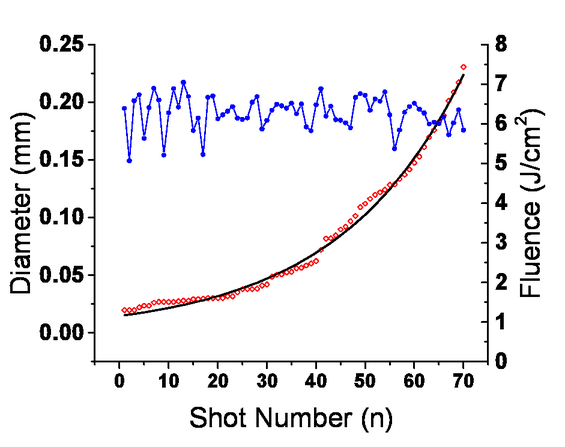 By repeating the measurements depicted in Fig. 1 one at a time on a collection of damage sites at various fixed (targeted) laser fluences the α(ϕ) response can be mapped (see Fig. 2). This data was collected for sites all with initial diameters in the ~100 μm range. This multi-shot approach can be time consuming and ignores the observed statistical variations that may be observed in Fig. 1 (larger than experimental uncertainties). Namely, each site is not exposed to n shots of single laser fluence but a series of shots which vary around an average fluence, and the measured diameter of the damage site tend to be either larger or smaller than the exponential fit. The first phenomena can partially account for the second; however significant discontinuities in the growth that are not correlated to fluence fluctuations are observed and are not represented in the reduced data of figure 2. II.Development of the Parallel Growth TechniqueThe Parallel Growth Technique was developed to rapidly acquire data by simultaneously testing many sites with a large area beam (~10 cm2). Samples are prepared with numerous (~20 - 200 depending on the intended final site size) damage sites initiated on a grid. The grid spacing is determined by the targeted final site size and is selected to maximize the number of sites studied while minimizing the interaction between adjacent sites, i.e. separation is the larger of 2 mm or on the order of twice the final site size. Because monolithic (single pit) damage sites are desirable, all sites on a sample are initiated (using a sub-mm laser beam from a table top system) with a maximum fluence that will produce a majority of single pit sites. The fluence restriction results in some locations not having sites initiate. In addition to the damage sites, the samples also have CO2 laser machined fiducials strategically placed to aid in fluence registration (see Fig. 3). Figure 3a) left, Sample preparation consists of inducing up to 200 damage sites with a ~450um diameter laser beam at 3ω, ~30 J/cm2 on the exit surface. b) right, image of an as-initated site  These on-sample fiducials are used in conjunction with additional fiducials in the laser beam (see Fig. 4) to aid in determining the local fluence each damage site is exposed to. The in-beam fiducials are also produced by the same CO2 laser on a glass plate placed in an upstream relay plane of the laser system. The laser-machined features are engineered to scatter the light incident on them out of the beam without producing hot spots co-located with any surfaces in the optics chain. Figure 4(a) shows an (false color online) image of the 3-cm diameter laser beam as incident on the exit surface of the sample. Figure 4(b) is an image of the optical plane of the sample taken with the transmitted laser beam. Both sets of in-beam and sample fiducials can be clearly seen in the transmitted image allowing precise registration of the laser near field image (figure 4(a)) to the sample. This results in a registration of fluence to sample with an error equal to about the pixel size of the camera or ~30 microns. The correlation length of the fluence is typically 300 microns making for very precise determinations of local fluence. Figure 4Representative fluence maps (need color and spatial scales for NF) for (a) the near field and (b) the transmitted beams. The Beams in both images are approximately 3 cm in diameter.  Each damage site initiated on the sample is imaged with a robotic microscope before and after every laser exposure. The size of each damage site is determined by an image analysis algorithm that looks for a contiguous region where the gray counts deviate from the flattened background. The area of the detected site is reported as the diameter of a circular site with equivalent area or Effective Circular Diameter (ECD). The algorithm includes regions of sub-surface fracture, but not the occasional debris ejected by the growing sites; this is illustrated in Figure 5. When a sites ECD is measured to increase by less than about 2% the change is considered to be in the noise and an α of 0 is recorded. This effectively places a noise floor of α= 0.025 based on the automated image analysis. The noise floor can be pushed down approximately an order of magnitude by manual analysis or by using a hybrid technique where the change in site size is automatically evaluated after multiple shots of nearly identical fluence exposure. Figure 5Micrographs of a site before and after laser exposure. The outline around each site is the detection threshold for site surface area.  Because of the contrast in the beam, each of the ~200 sites exposed (when studding 100-micron diameter sites) on a single shot will see a range of local fluence but the registration technique described above allows the precise value of each to be determined. The difference in ECD before and after the laser exposure is used to calculate the alpha for that laser exposure per Eq. (1) and this alpha value is paired with the local fuence. This technique results in an alpha vs. fluence measurement for each damage site on every laser shot, i.e., in as few as 10 laser exposures some 2000 singleshot measurements are collected. Figure 6 shows such a collection of measurements from a sample with 136 sites exposed to 26 laser pulses (~3500 data points). III.Average growth behaviorsWhen the observed alphas are averaged over a narrow fluence range the resulting values are consistent with the alpha vs fluence curve generated by the multi-shot method described in figure 1. In addition to producing equivalent data to the serial multi-shot method in 1/10 the time, segregating the data using different criteria reveals additional growth behaviors. As an example of just one way this data can be used we consider the average growth rate with a fixed fluence and fixed pulse width of 5 ns flat in time as a function of site ECD. Figure 7 shows the average growth rate as a function of site size for a fixed fluence of ~10 J/cm2. The same data set can be cut any number of times, i.e., to make a family of curves segregated for any fluence from 5 to 11 J/cm2 and for site sizes from 30 to 300 microns in ECD. In section 7 this technique will be applied to individual site morphology. In addition to extracting average growth behaviors, study of the data sets of the type shown in figure 6 reveal a great deal about the statistical behavior of growing sites. By first segregating the alpha vs. fluence data by size and then plotting the fraction of observations where the growth rate is above the noise floor we see that the notion of a growth threshold is invalid, even when manual examination is used to enhance the sensitivity to slow growth. Indeed, the probability that a site will grow is a strong function of its size. For sites larger than about 30 microns the fluence needed for a 50% probability of growth approaches the values historically described as the threshold for growth. IV.Statistical growth behaviorsBeyond the probability of growth, additional statistical behavior can be observed. Again starting with measured alpha vs. fluence data and segregating by site size, we now look at the distributions of alphas produced by a narrow range of fluences. For example 8-9 J/cm2 fluence bin for sites between 50 and 100 microns ECD is isolated in Fig. 9 (a) and a histogram of alpha values can be generated as in Fig. 9(b) to reveal the shape of the growth rate distribution. Figure 9(a) Growth rate vs fluence measurements for sites in the size range of 50 to 100 microns. (b) The histogram of observed alphas for sites with ECDs between 50 and 100 microns exposed to fluences between 8 and 9 J/cm2.  Repeating this procedure for each 1 J/cm2 fluence intervals reveals that the distribution can be described by Weibull statistics using only two parameters, namely the scale (λ) and shape (k). As the fluence is increased, both the mean of the alpha distribution and k increase, as seen in Fig. 10. V.Application of statistical growth behaviors to growth projectionsThe advantages of parameterization of any growth distribution with τ, ϕ, and ECD allows the generation of a custom alpha distribution for each of n sites of arbitrary size with laser exposure of arbitrary laser fluence (within range)9, 24-26. When projecting the damage growth, damage an alpha can be picked from the PDF of the alpha distribution for each site. This Monte Carlo process can be repeated any number of times predicting a projected size for each site into the future. When this method is applied to a reasonable number of sites (more than 100) it can predict how the ensemble will evolve for up to ~10 shots with good accuracy (see figure 11.) Part of the reason this technique works well with ensembles of sites is that the errors on the individual site growth behaviors tend to cancel one another. When the correct alpha distribution is used, every erroneously large alpha projected for one site will be matched with another erroneously small alpha projected for a different site (or the same site on a different shot). Hence the global behavior of the ensemble is well predicted. One aspect of this is that the final, largest site size in the ensemble is also well predicted out to 10 or 15 shots. However, which particular site will be the largest is not well predicted. Figure 11Measured and projected PDF of site sizes after n shots. Dotted lines are measured size distributions and solid lines are Monte Carlo predictions based on the as-initiated size distribution, local fluence and Weibull generated alpha distributions. The accuracy of the predictions can be evaluated by comparing the similarities between the predicted and measured curves. By 29 shots enough errors have accumulated that the total number of sites in the 0 to 700 micron size range is significantly in error for the predicted PDF.  Indeed, when this method is used to predict the final size of individual sites (rather than an ensemble of sites) after only 9 shots it is much less successful. In a case study the final size of 36 individual sites was projected using the Weibull generated alpha distributions and knowledge of the local fluence each site is exposed to9. The final projected size of each site is divided by its measured size after the 9 exposures. A histogram of these ratios is plotted in figure 12. Counts within 0.9 and 1.1 represent predictions accurate to within +/-10%. Only about 1/3 of predictions had this level of accuracy and another 1/3 of predictions were off by at least a factor of 2. Because the predictions are for individual sites, scaling the number of sits up does not improve the fraction for which accurate growth will be predicted. VI.Physical site attributes which affect the stochastic nature of growthThe very fact that the growth response is a distribution with a width significantly larger than the experimental measurements can account for suggests that there are additional site attributes beyond the ECD of the site which influence growth rate. Improving the accuracy in predicting the evolution of individual sites likely relies on understanding which attributes are important and further refining the alpha distributions by the relevant attribute(s). Figure 13 illustrates a number of such attributes suspected of influencing the rate at which a site grows. Figure 13Schematic side view of a growing damage site and physicals attributes of a damage site suspected of affecting growth rate. Damage sites typically have a crater diameter to depth aspect ratio of 5:1, an expanded aspect ratio is used here for convenience of illustration.  In order to determine if any of these attributes are responsible for variations in the growth rate, we begin by thermal annealing (TA) the sample to 1000°C for 12 hours and noting the effect on growth rate27. Figure 14 shows that the growth rate of small sites (~30+ microns ECD) is temporarily suppressed for a few shots, while the growth rate for larger sites (~100+ microns ECD) is not affected. Once sites reach ~100 microns in ECD the effect of size on growth rate becomes less significant so the rate of growth of the sites on a single sample can be measured before and after thermal annealing to determine the effects of the latter on growth rate. Because the growth rate of small sites tends to change rapidly with size an accurate determination of the effect of the thermal anneal required the annealed sites to be compared to a set of control sites initiated and grown under the same circumstances but not annealed. To illustrate the effects of the thermal anneal the average observed rate of the annealed sites are divided by the average observed rate of their respective control populations. Figure 14Observed / Expected growth rate vs shot number for populations of small (~30 μm) and large (~100 μm) sites after thermal anneal. The growth rate of the small sites is significantly repressed for the first shot or two after thermal anneal while the growth rate of the large sites is not unaffected. Solid lines serve as guides to the eye.  The fact that only small sites exhibit a reduction in growth rate from this annealing suggests a differential analysis of the morphologies of large and small sites before and after thermal anneal. It should be noted that, while it would defeat the purpose of a differential analysis in this work, it has been shown that growth of the type of sites studied here can be completely arrested by sufficient temperature elevation16, 17, 28-35. Because of the positive effect on growth rate in the one population, but not on the other isolating the morphological feature(s) affecting growth rate is facilitated by removing the necessity of defining what amount of change is significant. Or perhaps it should be said that the amount of change is self-defined by being more significant in smaller sites than in large sites. To this effect we employ a number of diagnostics/metrology tools to ascertain which features warrant further study. We first generate two new populations of damage sites, namely small (~30+ microns) and large (~100+ microns) and measure them with each technique discussed below both before and after thermal annealing at 1100°C for 12 hours. First examined is the reduction in stress resulting from the 1100°C anneal. This is measured by back lighting each damage site with narrow band polarized light and applying a crossed polarizer before the objective of a microscope. As this is a dark field technique it is very sensitive to stress-induced birefringence (see figure 15). Figure 15Polarimetry images acquired with crossed polarizers. Signal includes light depolarized by both scatter and stress-induced birefringence.  The signal in the images of figure 15 is due to two sources, namely depolarization from light scattering by the structure of the damage site crater and stress-induced birefringence. It is not possible to ascertain the fraction of signal originating from each source in the crater, but outside the crater, in the absence of sub-surface fracture, the signal originates exclusively from stress-induced birefringence. This is visible in the 1st and 3rd quadrants of the images of both large and small sites taken before thermal annealing but not after. The observation that sites of both size types are ~equally affected indicates that residual stress is not likely a primary site characteristic driving growth rate. The more significant reduction in the signal from the crater itself for the small sites is discussed below. It has been demonstrated by Laurence36 et al that photoluminescence defects allow for energy absorption of subbandgap photons in SiO2. It would be expected that efficient annealing of these defects would significantly reduce the rate at which a site grows. Photoluminescence imaging is used on both population of sites before and after the same thermal anneal. Figure 16 shows significant reduction, but not elimination, in the photoluminescence signal for both large and small sites. So while the number of UV active defects is reduced (but not eliminated), the common changes in both populations of sites indicate that the density of absorbing defects is not primarily responsible for the observed reduction in growth rate. Lastly, by looking through the polished edge of the sample, a side-view of the sub-surface structure of each damage site is imaged. Figure 17 shows side-view microscope images of a large and small site before and after thermal anneal. For the latter case, the fracture under the small site appears completely closed, while residual fracture under the larger site remains. It is probable that for the 1100C anneal used here the fractures are still present, but have merely narrowed sufficiently for evanescent propagation in the instances where they are no longer visible to the white light microscopy used in figure 17 and also likely accounts for the reduction of signal from the crater of the small sites in figure 15 above. Figure 17Side-view microscopy shows the sub-surface fracture associated with both large and small sites before and after thermal anneal. While residual fracture remains in the larger sites, it has closed in it its entirety for the small population of sites.  Table 1 summarizes the findings of the differential morphological examinations. Of the features investigated, only subsurface fracture appears to be correlated to growth rate. Table 1Response of large and small site investigated attributes to thermal anneal and correlation to growth rate.
VII.Application of morphologically refined statistical growth behaviors to growth projectionsThe above evidence suggests that sub-surface fracture is a primary driver of growth rate. To test this hypothesis we manually review the micrographs before each laser shot for the sites used to generate the alpha distributions in the individual site growth projections in section 5. Most sites are found to contain a complex sub-surface fracture structure. A minority of sites are composed of an apparent few fractures on the surface only. Examples of these types of sites can be seen in figure 18. Comparison of many top down images as seen in Figure 18 with side-view images of the type seen in 17 has shown that sites of the low-fracture morphology type are nearly exclusively without subsurface fracture. Figure 18a) left, The population was separated coarsely into two types of sites Low-fracture and Typical. b) right, Alpha distribution has been divided proportionally by the fraction of each type of site present in the population used to create it.  Repeating the individual site projection Monte Carlo calculations discussed above, but using the morphology-refined alpha distributions (classification) appropriate for each site type on the shot in question, the accuracy of the projections can be significantly improved. (figure 19). VIII.ConclusionsIn this and previous studies we have found that the laser parameters affecting average growth rate on the exit surface of SiO2 include: fluence, wavelength, and pulse duration. The onset of growth is better described as a probability of growth than as a threshold. Weibull statistics allow accurate predictions of ensembles of sites. A number of site attributes have been studied but only diameter and sub-surface fracture are seen to overtly affect growth rate. Predictions for individual sites are enhanced by using both site morphology and diameter to segregate specific alpha distributions. This work was performed under the auspices of the U.S. Department of Energy by Lawrence Livermore National Laboratory under Contract DE-AC52-07NA27344. [LLNL-PROC-674807] ReferencesA. K. Burnham, L. Hackel, P. Wegner, T. Parham, L. Hrubesh, B. Penetrante, P. Whitman, S. Demos, J. Menapace, M. Runkel, M. Fluss, M. Feit, M. Key and T. Biesiada, P Soc Photo-Opt Ins, 4679 173
–185
(2002). Google Scholar
J. T. Hunt, K. R. Manes and P. A. Renard, Appl Optics, 32
(30), 5973
–5982
(1993). Google Scholar
J. D. Lindl, O. L. Landen, J. Edwards, E. I. Moses, J. Adams and e. al, Phys Plasmas, 21
(12),
(2014). Google Scholar
J. A. Menapace, B. Penetrante, D. Golini, A. Slomba, P. E. Miller, T. Parham, M. Nichols and J. Peterson, P Soc Photo-Opt Ins, 4679 56
–68
(2002). Google Scholar
J. Bude, P. Miller, S. Baxamusa, N. Shen, T. Laurence, W. Steele, T. Suratwala, L. Wong, W. Carr, D. Cross and M. Monticelli, Opt Express, 22
(5), 5839
–5851
(2014). Google Scholar
M. A. Norton, C. W. Carr, D. A. Cross, R. A. Negres, J. D. Bude, W. A. Steele, M. V. Monticelli and T. I. Suratwala, P Soc Photo-Opt Ins, 7842
(2010). Google Scholar
T. I. Suratwala, P. E. Miller, J. D. Bude, W. A. Steele, N. Shen, M. V. Monticelli, M. D. Feit, T. A. Laurence, M. A. Norton, C. W. Carr and L. L. Wong, J Am Ceram Soc, 94
(2), 416
–428
(2011). Google Scholar
R. A. Negres, D. A. Cross, Z. M. Liao, M. J. Matthews and C. W. Carr, Opt Express, 22
(4), 3824
–3844
(2014). Google Scholar
Z. M. Liao, G. M. Abdulla, R. A. Negres, D. A. Cross and C. W. Carr, Opt Express, 20
(14), 15569
–15579
(2012). Google Scholar
R. A. Negres, G. M. Abdulla, D. A. Cross, Z. M. Liao and C. W. Carr, Opt Express, 20
(12), 13030
–13039
(2012). Google Scholar
C. W. Carr, D. A. Cross, M. A. Norton and R. A. Negres, Opt Express, 19
(14), A859
–A864
(2011). Google Scholar
R. A. Negres, M. A. Norton, D. A. Cross and C. W. Carr, Opt Express, 18
(19), 19966
–19976
(2010). Google Scholar
M. J. Matthews, S. T. Yang, N. Shen, S. Elhadj, R. N. Raman, G. Guss, I. L. Bass, M. C. Nostrand and P. J. Wegner, Adv Eng Mater, 17
(3), 247
–252
(2015). Google Scholar
Y. Jiang, C. M. Liu, C. S. Luo, X. D. Yuan, X. Xiang, H. J. Wang, S. B. He, H. B. Lu, W. Ren, W. G. Zheng and X. T. Zu, Chinese Phys B, 21
(5),
(2012). Google Scholar
I. L. Bass, G. M. Guss, M. J. Nostrand and P. J. Wegner, P Soc Photo-Opt Ins, 7842
(2010). Google Scholar
I. L. Bass, V. G. Draggoo, G. M. Guss, R. P. Hackel and M. A. Norton, High-Power Laser Ablation VIPts 1 and 2, 6261 A2612
–A2612
(2006). Google Scholar
L. Lamaignere, H. Bercegol, O. Bouchut, A. During, J. Neauport, H. Piombini and G. Raze, High-Power Laser Ablation VPts 1 and 2, 5448 952
–960
(2004). Google Scholar
M. D. Feit, A. M. Rubenchik, C. D. Boley and M. Rotter, Laser-Induced Damage in Optical Materials: 2003, 5273 145
–154
(2003). Google Scholar
M. A. Norton, E. E. Donohue, M. D. Feit, R. P. Hackel, W. G. Hollingsworth, A. M. Rubenchik and M. L. Spaeth, P Soc Photo-Opt Ins, 6403 L4030
–L4030
(2007). Google Scholar
M. A. Norton, E. E. Donohue, M. D. Feit, R. P. Hackel, W. G. Hollingsworth, A. M. Rubenchik and M. L. Spaeth, P Soc Photo-Opt Ins, 5991 99108
–99108
(2005). Google Scholar
L. Gallais and J. Y. Natoli, Appl Optics, 42
(6), 960
–971
(2003). Google Scholar
A. M. Rubenchik and M. D. Feit, P Soc Photo-Opt Ins, 4679 79
–95
(2002). Google Scholar
L. Lamaignere, G. Dupuy, T. Donval, P. Grua and H. Bercegol, Appl Optics, 50
(4), 441
–446
(2011). Google Scholar
R. Beeler, A. Casey, A. Conder, R. Fallejo, M. Flegel, M. Hutton, K. Jancaitis, V. Lakamsani, D. Potter, S. Reisdorf, J. Tappero, P. Whitman, W. Carr and Z. Liao, Fusion Eng Des, 87
(12), 2020
–2023
(2012). Google Scholar
R. A. Negres, Z. M. Liao, G. M. Abdulla, D. A. Cross, M. A. Norton and C. W. Carr, Appl Optics, 50
(22), D12
–D20
(2011). Google Scholar
Z. M. Liao, J. Huebel, J. Trenholme, K. Manes and C. W. Carr, Appl Optics, 50
(20), 3547
–3552
(2011). Google Scholar
R. N. Raman, R. A. Negres, M. J. Matthews and C. W. Carr, Opt Mater Express, 3
(6), 765
–776
(2013). Google Scholar
J. J. Adams, M. Bolourchi, J. D. Bude, G. M. Guss, M. J. Matthews and M. C. Nostrand, P Soc Photo-Opt Ins, 7842
(2010). Google Scholar
Z. Fang, Y. A. Zhao, W. Sun, Z. H. Li, G. H. Hu, X. F. Liu, D. W. Li and J. D. Shao, Opt Eng, 53
(8),
(2014). Google Scholar
Y. Jiang, X. Xiang, C. M. Liu, C. S. Luo, H. J. Wang, X. D. Yuan, S. B. He, W. Ren, H. B. Lu, W. G. Zheng and X. T. Zu, Chinese Phys B, 21
(6),
(2012). Google Scholar
S. Z. Xu, X. T. Zu and X. D. Yuan, Chin Opt Lett, 9
(6),
(2011). Google Scholar
W. Dai, X. Xiang, Y. Jiang, H. J. Wang, X. B. Li, X. D. Yuan, W. G. Zheng, H. B. Lv and X. T. Zu, Opt Laser Eng, 49
(2), 273
–280
(2011). Google Scholar
C. Y. Wei, H. B. He, Z. Deng, J. D. Shao and Z. X. Fan, Opt Eng, 44
(4),
(2005). Google Scholar
R. M. Brusasco, B. M. Penetrante, J. A. Butler and L. W. Hrubesh, P Soc Photo-Opt Ins, 4679 40
–47
(2002). Google Scholar
L. W. Hrubesh, R. B. Brusasco, W. Grundler, M. A. Norton, E. E. Donohue, W. A. Molander, S. L. Thompson, S. R. Strodtbeck, P. K. Whitman, M. D. Shirk, P. J. Wegner, M. C. Nostrand and A. K. Burnham, P Soc Photo-Opt Ins, 4932 180
–191
(2002). Google Scholar
T. A. Laurence, J. D. Bude, N. Shen, T. Feldman, P. E. Miller, W. A. Steele and T. Suratwala, Appl Phys Lett, 94
(15),
(2009). Google Scholar
|