|
|
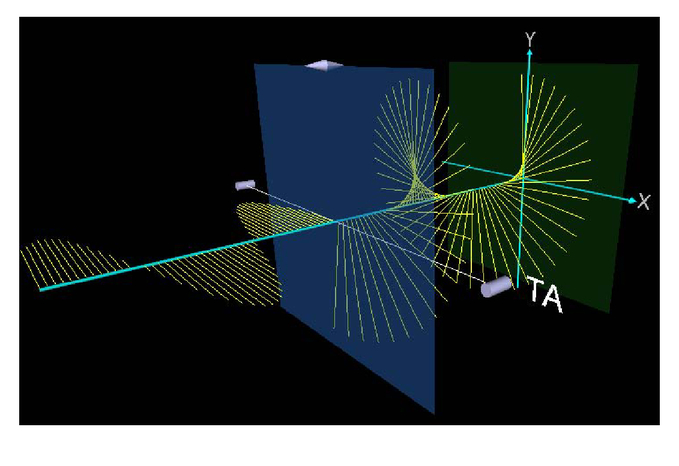
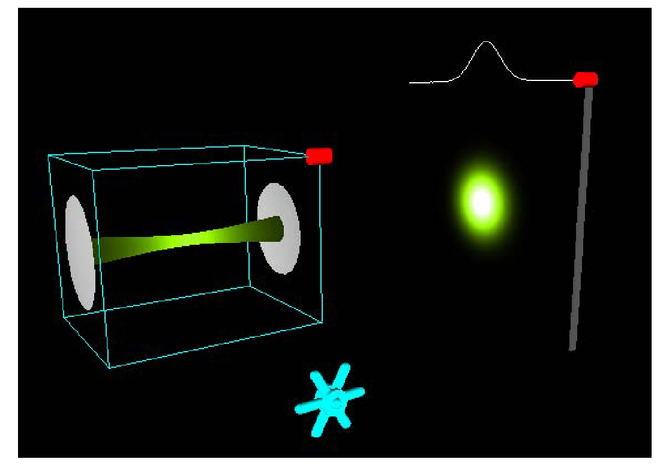
1.IntroductionThe Optics Project on the Web (WebTOP) is a Web-based 3D interactive computer graphics system that simulates optical and wave phenomena [1-3]. Its purpose is to help instructors teach and students learn about waves and optics. The current version includes sixteen modules: Waves, Lenses, The Eye, Reflection and Refraction/Vectorial, Reflection and Refraction/Waves Two Media, Reflection and Refraction/Waves Three Media, Polarization, Michelson Interferometer, Fabry-Perot Etalon, Fraunhofer N-Slit, Transmission Grating, Rayleigh Resolution, Fresnel Single Slit, Fresnel Circular, Scattering, and Lasers. Each of the modules includes an interactive simulation, an overview of the relevant theory, a showcase of examples, and a list of suggested exercises. The WebTOP simulations are implemented using the Virtual Reality Modeling Language (VRML) [4], Java, and the External Authoring Interface [5]. They run in Microsoft’s Internet Explorer Web browser with the Blaxxun Contact 5.0 VRML browser plug-in installed [6]. WebTOP simulations include VCR-type controls that allow users to record their interaction with the simulation in the form of small XML scripts [7]. The scripts are human-readable and can be easily edited. They can be used for viewing a pre-recorded session, setting up example web pages, or for simply initializing modules. WebTOP is used to help teach both upper-level undergraduate (junior/senior) optics courses and/or the wave and optics parts of introductory physics courses (both calculus-based and algebra-based) in more than a dozen universities. In this paper we first describe the features of a typical module, and then discuss the capabilities of each module. Finally, the use of WebTOP in classroom settings is discussed. 2.Features of a WebTOP moduleA typical WebTOP module window is shown in Fig. 1. It has five basic parts: the Scene, the Navigation Icons, the Console, the Recording Panel, and the Activities Menu. Each of these will be described below. Fig. 1.The WebTOP window for the Fresnel Single Slit Module. Underlined labels indicate the five basic parts of the window; the other labels point to the widgets used in the module.  The Scene is the interactive 3D simulation itself and occupies the largest part of the Web page. It usually consists of a light source, a variety of optical elements, and an observation screen. The parameters of these items can be modified either by direct manipulation of the “widgets” in the scene, or by typing the desired parameter values into the appropriate text entry boxes on the Console. For example, in the Fresnel Single Slit module shown in Fig. 1, the scene consists of a single slit, an observation screen, and three kinds of widgets that allow the user to change the parameters of the simulation. In this module a monochromatic plane wave of wavelength λ is normally incident upon a slit of width w. The resulting diffraction pattern is observed on an observation screen that is a distance z from the plane that contains the slit. Spinning the Wavelength widget changes the wavelength. Pulling on the Width widget changes the width of the aperture. Pulling on the Screen widget changes z. The Navigation Icons allow the user to control the appearance of the scene. From left to right in Fig. 1 they are: the Viewpoint icons, the Zoom icon, the Pan icon, the Rotate icon, and the Hide Icons icon. The Viewpoint icons (the Fresnel Single Slit module shown in Fig. 1 has two) return the scene to predefined orientations. The Zoom icon allows the user to zoom into or out of the scene. The Pan icon allows the user to translate the scene left/right or up/down. The Rotate icon allows the user to rotate the scene. The Hide Icons icon allows the user to hide and show all the other navigation icons. The Console is near the bottom of the window (see Fig. 1). It has three functions. First, it tells the user the current values of the input parameters, and the values of other important quantities. For example, in Fig. 1 the Console is reporting that the values of the input parameters are wavelength = 550 nm, slit width = 0.55 mm, and z = 21.06 mm, and that the value of the Fresnel number is 6.6. The second purpose of the console is to allow users to change the input parameters by typing in the desired values. The third function of the Console is that it provides context sensitive help messages on the use of the widgets, and read-outs from sensors in the scene. For example, if the mouse cursor is placed over the observation screen in Fig. 1, the console reports the corresponding position on the screen and intensity at that point. The Recording Panel is at the bottom of the window. It contains VCR-like controls that allow the user to record a WebTOP session, store it in the form of a script, and then play the script back at a later time. Scripts can also be used to provide example web pages or to set up the initial parameters for a module. The names of the buttons in the Recording panel are, from left to right: Reset, Record, Play, Pause, Stop, and Open. There are two modes of operation of the recording feature of WebTOP, the RAM-Mode and the Disk Mode. In the RAM mode, the user can record a session and replay it but cannot save it to disk. The recording is lost when the user closes the browser. The disk mode allows the user to save the sessions to the computer hard disk and to open and play sessions that are on disk. In order to use the Disk mode you must install the WebTOP recording library on your computer. When placed on a website, WebTOP scripts can be replayed even by users who choose not to install the recording library. The Activities Menu is at the top of the window. It lists the five activities available in WebTOP: the title of the module (Fresnel Single Slit in this case), Directions, Theory, Examples, and Exercises. It also provides a link to the other modules. The title provides access to the interactive simulation itself. The Directions activity contains documentation on how to interact with that particular module. The Theory section presents an overview of the physics being simulated in the module. The Examples section is a Web page that contains descriptions of and links to previously recorded WebTOP sessions in the form of scripts. The scripts are loaded by clicking on the name of the example, and then played by clicking on the Play button on the Recording Panel. The Exercises section provides exercises for the user to try. These are inquiry-based exercises in that the user is asked to interact with the module, observe how the simulation changes, and then come up with an explanation for what is happening. Clicking on Other Modules displays a list of the other modules that the user can access. 3.The WebTOP modulesIn this section we will provide a short description of each of the sixteen WebTOP modules. The Waves module simulates waves in a ripple tank. The user can place one or more monochromatic point sources and/or monochromatic line sources on the water surface. The module shows the resultant disturbance, either as a still picture or as traveling waves. For each point source the user can interactively vary the amplitude, wavelength, and initial phase of the wave it generates, as well as the position of the source. For each line source the user the user can vary the amplitude, wavelength, direction of propagation, and initial phase of the wave it generates. In Fig. 2 the Waves module is simulating the interference of the waves from two point sources. Figure 3 illustrates the Lenses module. This module simulates the behavior of light rays as they pass through a system of lenses and stops on an optical bench. The user can choose from amongst several different objects: an on-axis point source, an off-axis point source, a point source at infinity, five point sources in the shape of a T (as in Fig. 3), etc. The user can put an unlimited number of lenses and stops on the bench. The position, diameter and focal length of each lens can be varied interactively, as can the position and diameter of each stop. Each point source on the object emits a large number of rays at random angles, and these rays travel through the system according to the laws of paraxial geometrical optics. A movable observation screen allows the user to see the ray distribution in any plane perpendicular to the axis of the bench. The Eye module simulates image formation by a human eye with either normal vision or vision that needs corrective lenses. The user controls the position of the object being observed, the length of the eye, and the minimum and maximum focal lengths of the eye. The eye automatically accommodates as the object is moved. In addition, the module allows the user to place a corrective lens (either an eyeglass lens or a contact lens) in front of the eye to see the effect that this has on the image formed. Since the object distance and the eye length scales are typically quite different, two views are depicted simultaneously: a far away view which shows the object and a small eye, and a close-up view that shows the image on the retina, the corrective lens (if any) and the rays of light entering the corrective lens-eye combination. In Fig. 4 below, an object is outside the far point of a myopic eye, and the resulting image formed by the eye is in front of the retina. Fig. 4The Eye module. The object (yellow arrow) is outside the far point of a myopic eye, and the image (red arrow) formed by the eye is located in front of the retina. The position of the retina is denoted by the white line. 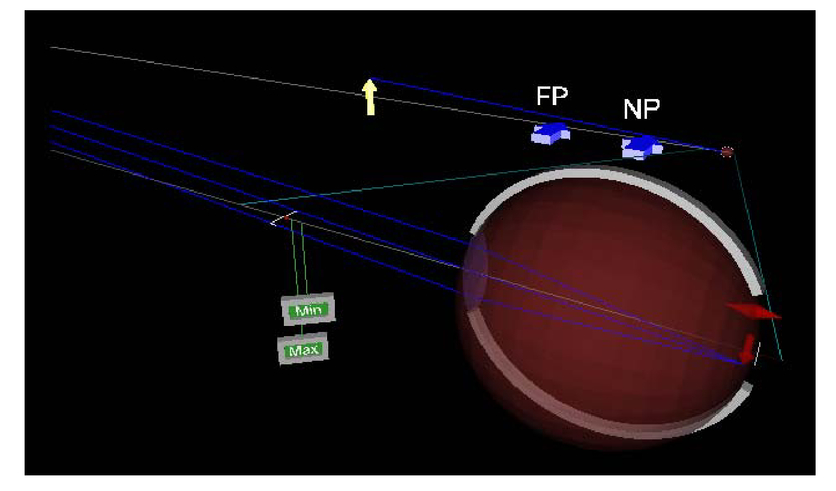 In the Reflection and Refraction/Vectorial module light is incident upon a planar interface that separates two homogeneous media (see Fig. 5 below). The user can choose the incident electric field to be either completely polarized or to be unpolarized. In the completely polarized case, the user can interactively vary the wavelength, the angle of incidence of the incident wave, the amplitudes of the two components and the phase difference between them. The corresponding time-varying incident, reflected, and transmitted (refracted) electric field vectors along the corresponding ray paths are displayed on the screen. The user can select which components of the electric field are displayed. Fig. 5The Reflection and Refraction/Vectorial module. Circularly polarized light is incident from air onto glass at Brewster’s angle  The Reflection and Refraction/Waves Two Media module simulates a monochromatic plane wave of s-polarized light incident upon a planar interface that separates two homogeneous media (see Fig. 6). Instead of displaying the relevant electric field vectors, as is done in the Reflection and Refraction/Vectorial module, the wave functions for the electric fields on both sides of the interface are depicted as waves in a ripple tank. On one side of the “borderline” between the two media, the user can display either the incident wave, the reflected wave, or the superposition of the two. On the side of the borderline, the transmitted wave is displayed. The user controls the wavelength, amplitude, and angle of incidence of the incident wave, and the indices of refraction of the two media. Fig. 6The Reflection and Refraction/Two Media module. S-polarized light is incident from glass (on the left) onto air at an angle of incidence greater than the critical angle.  The Reflection and Refraction/Waves Three Media module (see Fig. 7) is an extension of the Waves Two Media module. It simulates a monochromatic plane wave of s-polarized light as it travels through three different homogeneous media. The wave functions for the electric fields in each of the media are depicted as waves in a ripple tank. The user controls the wavelength, amplitude, and angle of incidence of the incident wave, the indices of refraction of each of the three media, and the thickness of the second medium. Fig. 7The Reflection and Refraction/Three Media module. Frustrated Total internal reflection is depicted.  The Polarization module (see Fig. 8) simulates the propagation of the electric field vectors of either a completely polarized or unpolarized plane wave of light and the effects of various optical elements (linear polarizers and wave plates) on the corresponding electric field vectors. The user controls the properties of the incident field, and the type, location, and characteristics of the optical elements being used. For a linear polarizer the user can vary its position and the angle that its transmission axis (TA) makes with the positive x-axis. For a wave plate the user can vary its position, the angle that its fast axis makes with the positive x-axis, and its thickness in units of the incident wavelength. In the Michelson Interferometer module light from a monochromatic point source is incident upon a Michelson interferometer (see Fig. 9). The resultant intensity pattern is displayed on an observation screen, and a graph of the intensity as a function of position across the center of the pattern is displayed above the observation screen. The user can vary the wavelength of the incident light, the rotation angle of the tilt mirror, and the position of the translation mirror. In the Fabry-Perot Etalon module light from a monochromatic point source is incident upon a dielectric slab whose surfaces are coated with a reflective coating (see Fig. 9). The resultant interference pattern is displayed on an observation screen, and a graph of the intensity as a function of position across the across the center of the pattern is displayed above the observation screen. The user can vary the wavelength of the incident light, the reflectivity of the faces of the slab, the thickness of the slab, and the index of refraction of the slab The Fraunhofer N-Slit module simulates a plane wave of monochromatic light of wavelength λ that is normally incident upon a plane that contains N identical slits (N ≥ 1). The resulting intensity pattern is displayed on an observation screen, and a graph of the intensity as a function of position across the screen is displayed above the observation screen (see Fig. 10). The user can vary the wavelength of the incident light, the number of slits, the slit width, the distance between consecutive slits, and the distance from the slit plane to the observation plane. Moving the cursor over the screen causes the intensity at that point to be displayed on the console In the Transmission Grating module a polychromatic plane wave is incident upon a transmission diffraction grating, and the resulting intensity pattern is displayed on a semicircular observation screen (see Fig. 10). The user can select the spectrum of the incident light to be that of a pre-defined standard gas discharge tube (hydrogen, helium, sodium, or mercury), or can create a “user defined” spectrum by entering various wavelengths. The mouse cursor acts as a sensor and, when placed over the observation screen, allows the user to read the angular position of the cursor (and hence the position of the various diffracted orders on the screen). In the Rayleigh Resolution module monochromatic light from two distant point sources separated by a small angle is incident upon a lens (see Fig. 11). The resulting intensity pattern is viewed on an observation screen positioned in the focal plane of the lens, and a graph of the intensity as a function of position across the center of the pattern is displayed above the observation screen. The user can vary the wavelength λ of the light, the angle θ between the sources, and the diameter D of the lens. The Console displays, in addition to the values of λ, D, and θ, the value of the minimum angular separation for which the two images can be resolved (according to the Rayleigh resolution criterion). In the Fresnel Single Slit module a monochromatic plane wave of light is normally incident upon a single slit (see Fig. 11). The resulting diffraction pattern is observed on an observation screen, and a graph of the intensity as a function of position across the screen is displayed above the observation screen. The user can vary the wavelength of the light, the width of the slit, and the distance from the slit to the observation screen. The parameter ranges are such that the user can explore the Fresnel region, and the beginning of the Fraunhofer region. Moving the cursor over the screen causes the intensity at that point to be displayed on the console. In the Fresnel Circular module a monochromatic plane wave of light is normally incident upon either a circular aperture or a circular obstacle (see Fig. 12). The resulting diffraction pattern is observed on an observation screen, and a graph of the intensity as a function of position across the screen is displayed above the observation screen. The user can vary the wavelength of the light, the diameter of the aperture or obstacle, and the distance from it to the observation screen. Moving the cursor over the screen causes the intensity at that point to be displayed on the console. The parameter ranges are such that the user can explore the Fresnel region, and the beginning of the Fraunhofer region. The Scattering module simulates the non-resonant scattering of light from an atom (see Fig. 13). The atom is located at the origin, and the incident light is traveling along the negative y-axis in the positive y-direction. An oscillating vector depicts the induced dipole moment of the atom. Scattered electric field vectors are depicted at sets of observation points along three different axes: the positive x-axis, the positive z-axis, and a movable axis whose angular position can be varied by the user. The user can choose the incident electric field to be either linearly polarized or unpolarized. When the incident light is linearly polarized, the user can change the amplitudes of the two components of the electric field vector and the wavelength of the light. The Lasers module simulates the behavior of an optical resonator oscillating in one of the following four transverse modes (the user selects which one): TEM00, TEM10, TEM01, or TEM11. The scene consists of a cavity that has a spherical mirror on each end. The resulting intensity pattern is displayed on an observation screen, and a graph of the intensity as a function of position across the center of the pattern is displayed above the observation screen. The user can vary the wavelength of the light, the radius of curvature of each of the mirrors, the length of the cavity, and the position of the observation screen. In Fig. 14 the Lasers module is simulating the TEM00 laser mode. 4.Using WebTOP for teaching and learningWebTOP can be used to help teach an optics course or the waves and optics portion of an introductory physics course, and it can be used by faculty and students in a variety of ways. It can be used for in-class demonstrations. Its three-dimensional nature allows the presenter to show the phenomenon from the most advantageous viewpoint. The ability to change the values of all the relevant parameters in a simulation allows the instructor to show, in real time, the effect of changing each parameter in a way that can be seen clearly by the students, even in large lecture halls. More importantly, using WebTOP to present material lends itself to “What will happen if …” kinds of questions, providing an ideal mechanism for creating an active learning environment [8]. Furthermore, WebTOP can be used for homework assignments. Students can be asked to complete homework sets in which they are asked to produce numerical or qualitative answers to questions, and then use WebTOP to simulate the situation and check their answers. The students turn in their written answers to the questions and the corresponding screen captures from the relevant WebTOP module. WebTOP can also be used to supplement laboratory activities. It can be used in pre-lab activities to help explain the phenomenon that is going to be investigated in the lab, or it can be used during the lab to compare actual data to the simulation results and to help draw inferences when equipment limitations occur. Finally, WebTOP can be used for student projects. Students can work in teams or individually on particular problems and use WebTOP to help illustrate their presentations and reports. At Mississippi State University, WebTOP has been used to help teach upper level undergraduate optics courses, a graduate level lasers course, and the waves and optics part of two types of introductory physics classes: calculus-based and algebra-based. It has been used in the introductory courses almost every semester for the past three years, and student evaluations of WebTOP have been performed in every class in which it has been used. The student response to WebTOP has been very positive. In response to the question “How useful did you find the WebTOP demonstrations during class for the visualization and understanding of the optical phenomena in this course?” the 335 students surveyed rated WebTOP 4.53 on a scale of 5. In response to the question “How useful did you find the WebTOP homework during class for the visualization and understanding of the optical phenomena in this course?” the 335 students surveyed rated WebTOP 4.27 on a scale of 5. 5.ConclusionIn teaching and learning optics, we often deal with content that is difficult to understand without good visualizations. WebTOP provides a means to easily visualize phenomena in 3D, allowing users to both look at phenomena from different angles and answer “what if” type questions. WebTOP has been shown to be an effective tool for classroom demonstrations and for homework assignments. It can also be used to help supplement laboratory activities and for student projects. However, WebTOP is not a finished product. We have plans to develop more curriculum material based on WebTOP modules and to develop more modules. We also plan to make WebTOP open source. This will enable users to modify and expand WebTOP, and to adapt its techniques to their particular projects. For more details about WebTOP’s progress visit its website at: http://webtop.msstate.edu. AcknowledgementWebTOP is supported by the National Science Foundation Grant DUE 9950569 and DUE 0231217. 6.6.ReferencesJ. T. Foley, K. Vidimce, D. C. Banks, and T. Mzoughi,
“WebTOP: Interactive 3D Optics Simulations on the Web,”
in Sixth International Conference on Education and Training in Optics and PhotonicsProc. SPIE,
214
–222
(2000). Google Scholar
K. Vidimce, J. T. Foley, D. C. Banks, Y. T. Chi, and T. Mzoughi,
“WebTOP: Interactive Optics on the Web,”
in The Web3D/VRML 2000 Symposium,
125
–129
(2000). Google Scholar
T. Mzoughi, J. T. Foley, S. D. Herring, M. Morris, and B. Wyser,
“WebTOP: Web-Based Interactive 3D Optics,”
in Proceedings of the Sixth International Conference on Computer Based Learning in Science (CBLIS 2003),
Google Scholar
C. Rikk and B. Gavin, The Annotated VRML 2.0 Reference Manual, Addison-Wesley Longman Ltd, Essex, UK.
(1997). Google Scholar
A. Phelps and E. Mason,
“External Authoring Interface Working Group,”
http://www.web3d.org/WorkingGroups/vrml-eai/ Google Scholar
,The Blaxxun Contact 5.0 VRML browser plug-in can be obtained from the Blaxxun Web site, http://www.blaxxun.com Google Scholar
, “World Wide Web Consortium, Extensible Markup Language (XML),”
http://www.w3.org/XML/ Google Scholar
D. R. Sokoloff and R. K. Thornton,
“Using interactive lecture demonstrations to create an active learning environment,”
Phys. Teach, 35 340
–343
(1997). https://doi.org/10.1119/1.2344715 Google Scholar
|