|
|
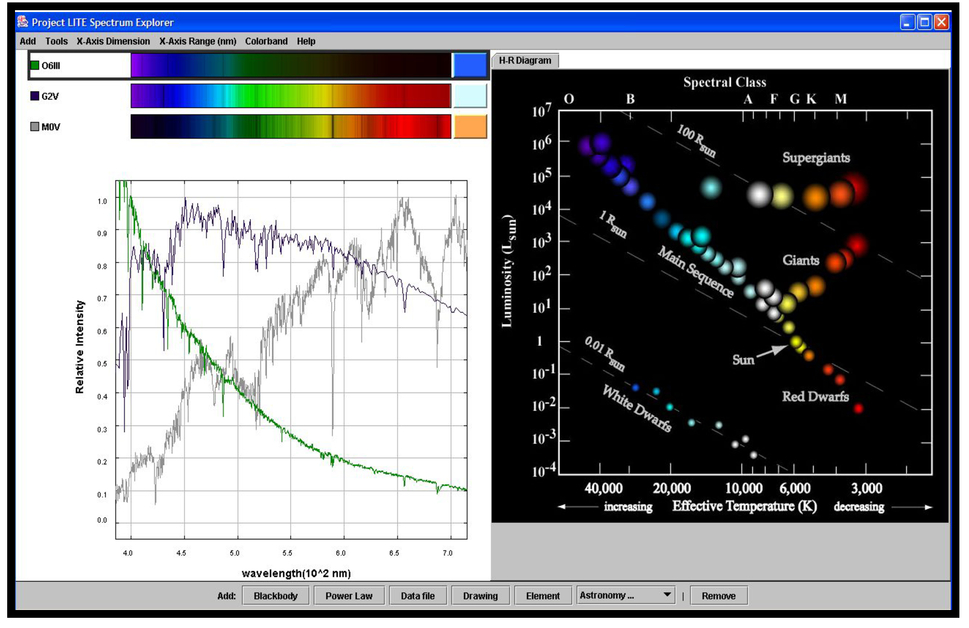
1.Introduction to Project LITE: Motivation and NeedThe only encounter that many undergraduates have with science during their college careers occurs in elective science distributional courses. These courses typically have lectures, discussion sections and, if offered at all, several in-school laboratory exercises. Such courses usually do not give students a chance to actually do science. A sports analogy might be trying to teach students basketball without actually letting them dribble or shoot the ball. Hands-on, inquiry-based, constructivist learning can offer students a unique opportunity to directly explore phenomena and gain insight into the nature of science. However, learning from direct experience can be time consuming and expensive. In order to provide students with a more rewarding learning experience, we have been developing inexpensive educational software, devices and activities that can be used in a wide range of introductory science courses and settings. These materials center on light. 1.1.Why Focus on Light?As we move into the 21st century, college students rarely have the opportunity to examine in depth the towering intellectual achievements of the 20th century concerned with the nature of light, even though some of these ideas are now almost a century old. Students who take high school and introductory college physics courses mainly encounter 18th century Newtonian mechanics, 19th century electricity and magnetism, and a bit about waves, vibrations and thermodynamics discovered during those centuries. But when do they learn about the great 20th century discoveries concerning light that derive largely from quantum theory and special relativity? Our understanding of light is, of course, inextricably woven into our understanding of matter. Light is a key component of many modern technologies and is used as the primary tool in many sciences ranging from astronomy to zoology. Without some familiarity with the properties of light, students cannot be expected to fully grasp modern science or the plethora of technologies surrounding them including LEDs in many devices, holograms on credit cards, lasers (in CD players and printers), computer screens and the fiber optics carrying the internet. Because of its centrality to human experience and great aesthetic and intellectual appeal, courses dealing with light can reach a broad spectrum of non-science majors. Students with few science prerequisites and knowledge only of pre-calculus mathematics can learn a great deal about light. 1.2.Project LITE Educational Goals.The American Astronomical Society Education Office recently conducted a survey of faculty members [1]. It found that light and the electromagnetic spectrum were “by far the most frequently cited topics” in a list of subjects that professors felt their students should understand. The two-part survey queried 29 college and university professors attending a national workshop on astronomy education, and also analyzed 37 college astronomy syllabi posted on the Web. Among the findings: of six topics deemed “highly essential” – electromagnetic spectrum, radiation, redshift, Hertzsprung-Russell diagram, stellar evolution and mass – half were directly concerned with light and many other topics, such as the meaning of the H-R diagram and evidence for the expansion of the universe, require an understanding of the properties of light. The study also found that (in 2001) 38% of the students of the professors surveyed are required to use the Internet as part of their course activities. Informal inquiries indicate this percentage has since increased to nearly 100%. In an independent survey [2] of 44 instructors attending three national workshops called “Teaching Astronomy Conceptually”, Zeilik and Morris-Dueer reported that in ranking 200 concepts often taught in “Astronomy 101” courses, the electromagnetic spectrum was ranked the highest. Project LITE is developing innovative materials about light, directly addressing 5 of the 6 “highly essential” topics cited in the AAS study along with many others. The LITE outcomes are being designed for use in the context of the large (typically 50 – 200 students per class per semester) and popular (estimated nationally at 250,000 students per year) introductory college astronomy courses for non-science majors. Some of the LITE software and devices are also valuable for astronomy majors’ courses. Up until now, Project LITE has largely been guided by two core strategies: (1) make optimal use of personal computers and peripheral devices as actual experimental laboratories; and (2) provide intellectually exciting and pedagogically sound laboratory exercises – for both in-school use and as “homelabs” - that guide students in an inquiry based manner to discover for themselves the most important ideas about light. These goals have been accomplished by developing software that controls the optical emission of computer screens and by developing associated optical materials and devices. Because of light’s broad accessibility and great intellectual and pedagogical value as a subject, we plan to expand our development of hands-on (actually eyes-on and mice-on!) activities about the nature of light for use in a wide variety of astronomy, physics, chemistry, teacher training, and even psychology courses. The technological developments of Project LITE have been guided by past and current research on student learning, particularly well documented in the physics education research literature. Students come to most subjects, including light and optics, with many preconceptions and/or misconceptions. In studies of K - 12 students, a variety of these notions have been uncovered. For example, studies have found that many students believe that the color of an object is independent of its source of illumination and that light exists only where it can be seen. Some students suggest that colored lights combine in the same way that colored paints do. A particularly egregious misconception held by many young people – especially for night joggers or bike riders - is that light colored objects can be seen even in total darkness. Studies of misconceptions held by college students about geometrical optics have also been carried out [3], as well as studies of misconceptions about topics related to physical optics [4]. However, no equivalent study has been conducted concerning student misconceptions about light in the context of astronomy (prior to the one we are doing). From our personal experience, gathered over three decades of teaching undergraduate astronomy courses, we have found that concept oriented demonstrations, along with direct manipulation and experimentation, can be effective in helping students learn. For example, the fundamental means by which astronomers gain an understanding of astronomical objects is from the application of Kirchhoff’s laws of emission and absorption of radiation. Despite lecture presentations and textbook discussions, students often come away stating that atoms actually emit absorption lines - that is, that atoms have the astonishing ability to emit blackness! We have developed simple demonstrations to help clarify the actual origin of absorption lines [5]. These can be used to help students understand how the interaction of light with atoms can lead to the formation of optical absorption lines. Still, even clear and simple lecture demonstrations alone do not guarantee that all or even most students achieve a reasonable understanding of the material covered. Consider, for example, a careful demonstration in lecture showing that for a thermal blackbody radiator, red means cooler and blue means hotter (which is the very opposite of a lifetime of miscues indicating that red means hot and blue means cold). Some students then deduce that the reason the Sun appears red at sunset is because it cools off! Therefore a major aim of Project LITE is to test the idea that with a set of well-designed hands-on laboratory explorations, more students will come to understand fundamental aspects of the physical world through personal experience. Exciting laboratory exercises can also motivate students to pursue their own open-ended explorations of topics regarding light, color and perception that interest to them. 1.3.Project LITE Educational Materials Development Goals.(A) Homelabs. “Homelabs” are a major focus of the project. In mathematics courses, students learn the subject best by solving problems. In English courses, students write essays. Ideally, these activities serve the dual purposes of developing technical proficiency while also stimulating creativity. In mathematics courses, having done many problems, students can confront new problems and, hopefully, solve them. In English courses, students learn the rules of grammar, spelling and punctuation, but also learn to express themselves clearly through the very act of writing. Likewise, we are investigating the idea that students can learn about the natural world the way scientists do: by doing experiments, creating models, and comparing the two. We have developed “homelabs” - inquiry based, take-home hands-on experiences. These include “guided discovery” activities, as well as more open-ended investigations. For example, we have students observe and measure the spectra of carefully chosen sources using a diffraction grating and then explore lights of their own choosing. Later they can do more quantitative studies using a direct view spectrometer or a spectrophotometer. Light and optics are particularly amenable to such homelabs, since the required materials are interesting, inexpensive and safe. The idea of homelabs for science learning is not without precedent (cf. [6], [7], [8] and [9]). However, none of these projects dealt mainly with light and, to the best of our knowledge, no university non-majors science course to date has made extensive use of homelabs as a major component of the learning experience. Furthermore, no one has previously developed homelabs that combine computer hardware and software with real optical materials. Is there evidence that homelabs are effective in enabling student learning? To date there have been very few controlled experiments with the use of take home laboratory experiences in universities. The electromagnetism Project ZAP at M.I.T. and Caltech [8] and the Carnegie-Mellon University “reform” electromagnetism curriculum [9] are two curricula that have employed homelabs. In the latter project, the developers found evidence for a significant increase in both student understanding and retention by comparing students taking either the traditional or the reform curriculum. It was found that all students (not just the most highly motivated) improved an average of one grade level (i.e., B to A or C to B) in their performance, and that the improvement in learning was manifest in both the short term (3 months later) and long term (2 years later) (Chabay, private communication). These results were from a calculus based majors course. (B) In-School Laboratory Exercises. One of the main reasons why many colleges and universities do not have a hands-on component for non-majors science courses is the lack of space, equipment and teaching assistants to run effective in-school laboratories. The majority of introductory college astronomy courses have only lectures. A prime motivation for the LITE homelabs is to relieve this problem. However, as a complement to lectures, classroom demonstrations and homelabs, we have also been developing hands-on activities that make use of in-school laboratory facilities. These include, for example, an inexpensive handheld binocular spectrometer that we have already developed for semi-quantitative spectroscopic observations, as well as an inexpensive PC coupled USB spectrophotometer that we have developed. There is evidence at the high school level, that organizing students into teams significantly enhances learning. Peer instruction has also shown success at the college level (cf. [11] and [12]). Some of the LITE products, such as the USB spectrophotometer, have been developed for use by students doing in-school laboratory exercises, either in groups or individually. We are interested in finding out whether working in groups leads to significantly greater student understanding, or whether, at the college level, students can learn the most important ideas and concepts just as well by working on their own either in school or at home. (C) Lecture Demonstrations. Many colleges and universities teach large numbers of students with a limited number of faculty and few laboratory resources. Large introductory science lecture courses are likely to continue in the near future so good, effective lecture demonstrations will continue to be of value in teaching. Project LITE has developed new, often-interactive, lecture demonstrations that employ novel software and optical materials. These are aimed at exciting students’ interest; dramatically demonstrating phenomena that are difficult to duplicate at home; and providing impetus, even in large lectures, for discussions between students, and between students and the instructor. Examples of such demonstrations can be found in references [5] and [13]. Several studies have found that interactive lecture demonstrations requiring active participation by students (e.g., making predictions of outcomes) can be very effective learning tools (cf. [14] and [15]). 2.Results To Date of Project LITEThere have been eight outcomes to date: (1) development of a kit of optical materials, software and 6 associated laboratory exercises; (2) development of the “Spectrum Explorer” software; (3) invention of a handheld binocular spectrometer; (4) development of an inexpensive electronic computer controlled and powered USB spectrophotometer; (5) development of a suite of over 250 controllable computer visual perception applets; (6) formative evaluation of learning gains by students resulting from use of the Project LITE materials; (7) development of a “Light and Spectroscopy Concept Inventory” to assess the effectiveness of education about light in various academic settings; and (8) dissemination of the LITE outcomes. Each of these is discussed below. 2.1LITE Kit, Software and HomelabsOur goal is to have students work directly with light and optical phenomena. Because of the wide availability of computers, and because a computer screen is itself a controllable source of light, we have developed computer software and a kit of inexpensive optical materials to allow students to directly experiment with light. One of the entirely novel and innovative aspects of Project LITE lies in this unique coupling of computers with inexpensive hands-on optical materials. Students can use the Project LITE software we have developed in conjunction with the materials contained in the LITE Optics Kit (shown in Figure 1 below), either in their homes or in school, to explore for themselves a range of actual light, optics and visual perception phenomena. We have already developed six laboratory exercises that take advantage of this concept for use in introductory undergraduate astronomy courses. The labs are about: (1) geometrical optics (lenses); (2) physical optics (diffraction); (3) color - of materials, the sky and stars; (4) fluorescence and phosphorescence; (5) emission, absorption and blackbody spectra; and (6) polarization of light. The Project LITE Web site http://lite.bu.edu contains all of our software developed to date. Figure 1.Project LITE Kit designed to be used in conjunction with applets viewed on a computer screen. 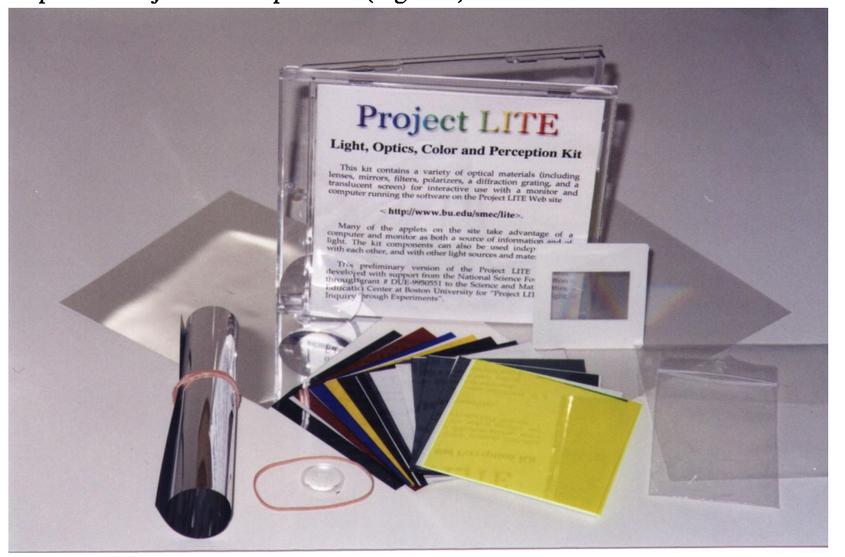 Before elaborating on the innovative nature of our approach to computer assisted science education, we note that there are many fine examples of computer software on the Web that simulate optical phenomena on computers. For example, the “Visual Quantum Mechanics” software found at http://perg.phys.ksu.edu/vqm/ developed by Dean Zollman at Kansas State University takes advantage of the ability to display and move objects on a screen. The Project “CLEA” labs found at http://www.gettysburg.edu/academics/physics/clea/CLEAhome.html - developed by Laurence Marschall at Gettysburg College - simulate astronomical observations. The FSU National Magnetic Laboratory site - http://micro.magnet.fsu.edu/primer/lightandcolor/index.html - contains, among many applets about light, elegant simulations of diffraction and interference. And the “Physics Education Technology” (PhET) site http://www.colorado.edu/physics/phet/web-pages/index.html at the University of Colorado, developed by Nobel Laureate Carl Weiman and his collaborators, has excellent simulations of a wide variety of physical phenomena, including several about light. By contrast with these and all other light and optics Web sites of which we are aware, the Project LITE site is the only one that makes use of the emissive optical properties of a computer screen. That is, many of the LITE applets are designed to enable students to perform actual experiments directly with the photons coming from the screen. We have developed the Project LITE Optics Kit (Figure 1) to be used with the LITE web site. The LITE kit contains optical elements that were carefully selected to match characteristics of computer screens - both CRT and LCD. The kit currently contains 21 optical elements: 6 colored and 2 neutral density filters for uses as varied as color subtraction, viewing 3-D images of comets and other astronomical objects and for testing stereopsis with both random dot stereograms and the Pulfrich phenomenon; 3 polarizers, quarter wave plate and birefringent material for studying a variety of physical and perceptual phenomena involving polarized light; 2 sheets of Mylar mirror for studying multiple reflection, anamorphosis and kaleidoscopic image making; 2 plastic lenses for studying geometrical optics (and making a Keplerian telescope); a translucent sheet for viewing screen images projected by the lenses; fluorescent and phosphorescent plastics for studying atomic excitation; and a diffraction grating. The parts are all contained in a CD case, which is part of the kit: as a structural element - to hold the translucent screen for projection; to hold the two mirrors for studying reflection; and as a birefringent material that displays physical stress. The cost for all of the components in the kit is under $5. How can these materials and software be combined? As an example, consider the Fluorescence applet. By placing the fluorescent plastic included in the kit in front of the screen, students find that only light containing photons that are energetic enough can excite the atoms in the plastic to fluoresce. This is both an actual physical demonstration and a model for astrophysical objects such as planetary nebulae. The Monitor Spectral applet can be used to enable students to determine for themselves the actual spectrum of the CRT screen phosphors or LCD screen pixels (and compare between monitors) using the diffraction grating included in the LITE kit. This applet is also used for the quantitative experimental study of diffraction. By moving the grating towards and away from the screen and by changing the color of the displayed line of light, students see that the angle of diffraction is directly proportional to the wavelength of light. Using the screen spectra displayed elsewhere on the LITE Web site, students can experimentally determine the line spacing of the grating. Other applets help students to explore topics as varied as color mixing and Mach bands. Each activity employs the computer as an actual optical device, not just as a simulator. However, where needed, we have also developed software that takes advantage of the computer’s computational and display potential to enable students to analyze data and simulate optical phenomena that are difficult or impossible to explore directly. We turn to that software now. 2.2Spectrum Explorer SoftwareWe have been developing a software applet/application that we call the “Spectrum Explorer” (SPEX) – see Figure 2. At its core, it is a spectrum display and analysis JAVA program that can be run either as an applet on the Web or as a downloadable application. It displays normalized and un-normalized spectra, with intensity plotted as a function of wavelength, frequency or photon energy. It simultaneously displays spectra as a graph and as a colorband. It shows connections to the underlying physics by including numerous scientific and pedagogical components. It can plot blackbody spectra of any temperature. It displays emission line spectra of any ionization state for all elements in the periodic table. It can plot power law spectra with adjustable spectral indices. It can apply a Doppler shift to spectra. It contains a freehand drawing tool, pop-up tool tips, right-click menu options on the color band, and the ability to make any spectrum editable by the user. SPEX contains measuring tools, zoom capabilities, and even a tool to sonify spectra (that is, to allow students – including the visually impaired – to hear light spectra). SPEX also has printing and exporting capabilities when being run as an application. It is our aim that SPEX will become for the display, manipulation and analysis of electromagnetic spectra what “PhotoShop” is for the processing and analysis of images, or Microsoft Word is for the manipulation of words (though, hopefully, SPEX is more user friendly than is Word). We have incorporated into SPEX many astronomical features including an interactive H-R diagram, a stellar evolution animation and an interactive Hubble tuning fork diagram. Current SPEX astronomical databases include stellar spectra of all spectral types, planetary nebula and supernova spectra, and plots of high-resolution Solar spectra centered on H-alpha and the sodium D doublet. Pilot testing of the software has been done from 2003 - 2007 with over 1,000 students in 100-level astronomy courses. It has also been used extensively in lectures. Students report that they like the look and feel of the interface and that the software is easy to use. 2.3Binocular SpectrometerWe have developed a unique quantitative handheld visual band spectrometer. The instrument employs a binocular design. Its main advantages are ease of use and effectiveness in making quantitative measurements. Our design alleviates common difficulties with alignment and with poorly lit wavelength scales that students report when using traditional monocular spectrometers. Novel features that enhance its efficacy include the use of an efficient holographic transmission diffraction grating, a variable-width entrance slit, and adjustable illumination of the wavelength scale. The binocular design eliminates the need to squint and significantly reduces eyestrain. Binocular viewing also appears to improve sensitivity to differences in contrast, resolution, and color. Two features that contribute to the ease of use and uniqueness of our instrument are the adjustable slit and removable scale flap. A variable slit gives the user the ability to adjust the width of the entrance slit to suit each individual task. While a narrow slit is beneficial for studying bright sources, it can also make aligning the instrument on a narrow source a very difficult task for a novice user. Students using the Project LITE binocular spectrometer will be able to open the slit wide to align the instrument and then narrow it down to achieve the best results for their quantitative measurements. A flap over the wavelength scale can be lifted up or secured down in order to allow the user to customize backlighting on the scale. The background can be fully illuminated by ambient light or made entirely black for qualitative spectroscopy – a feature particularly useful for observing narrow absorption lines such as the solar Fraunhofer lines. Boston University (assignee) on behalf of E. Weeks and K. Brecher (inventors) filed U.S. Patent Application No. 10/954,388 for the “Binocular Spectrometer” in 2004. The formal Notice of Allowance from the U.S. Patent Office was made in February 2007 with the patent number to follow in summer 2007. 2.4SpectrophotometerA second educational spectrometer was also developed. We want to know whether students will benefit from the hands-on nature of collecting, manipulating, and analyzing their own quantitative spectra. However, the high cost of commercially available USB based spectrophotometers currently available (>$1,000 - $2,000) has prevented their wide scale use in college astronomy education. We have worked with a team of four undergraduate senior electrical engineering majors to develop a relatively inexpensive (~$100) PC USB spectrophotometer. The prototype Project LITE spectrophotometer employs a 2048-pixel linear CCD array as a detector and connects to personal computers through a USB port. Light can enter the device either through a simple slit or through a fiber optic cable and be dispersed onto the detector by a diffraction grating. The spectrophotometer outputs a two-column stream of data (wavelength and flux) in real time and interfaces with the Spectrum Explorer software. 2.5LITE VisionAs part of Project LITE, we developed a suite of applets about visual perception. Though at first glance this might seem out of place in the framework of what has been primarily an astronomy and physics educational materials development project, it is, in fact, quite valuable. For example, following nine chapters devoted to the physics of light and optics in the first volume of the Feynman Lectures on Physics, there are two chapters devoted to color and the mechanisms of vision [16]. The authors remark, “There are many interesting phenomena associated with vision which involve a mixture of physical phenomena and physiological processes, and the full appreciation of natural phenomena, as we see them, must go beyond physics in the usual sense. We make no apologies for making these excursions into other fields, because the separation of fields, as we have emphasized, is merely a human convenience, and an unnatural thing. Nature is not interested in our separations, and many of the interesting phenomena bridge the gaps between fields”. Throughout history, astronomers and physicists have made many of the major contributions to the understanding of vision. Newton showed that white light could be separated into colors that are mainly a psychophysical phenomenon, remarking, “these rays are not colored”. Young, Maxwell and Helmholtz in the 19th century, Mach, Schrodinger, Land and many other physicists in the 20th century added major insights into vision. The LITE vision applets, like the astronomy and physics applets, use the computer to produce the actual phenomena. Over the past three years we have developed and posted on the LITE Web site more than 250 Flash and JAVA applets that elicit visual phenomena, the most extensive collection developed to date. The opening screen for the LITE vision applets is shown in Figure 3 below. The applets (which can also be run as applications) are all controllable allowing students to manipulate and vary the stimuli for a range of visual phenomena that cannot be achieved by viewing only a printed page. These applets - which involve color, lightness, motion, form and depth - are already being used in introductory psychology courses (which are taken by over a million students in the U.S. each year), as well as in more advanced courses on sensation and perception (at BU, Harvard, and elsewhere) and in informal settings (e.g., the Exploratorium). The LITE Vision Web site is included in the list of demonstrations on the vision science Web site (http://www.visionscience.com/). Results of our vision efforts have been presented at meetings of the Vision Sciences Society (VSS), the European Conference on Visual Perception (ECVP) and at the American Astronomical Society (cf., for example, [17], [18], [19], [20]). The applets are also being used in astronomy courses to clarify the relation between the perception of color and the wavelength of light. An understanding of what the “color” of stars means – e.g., as employed in constructing the H-R diagram and as is shown in a color patch in SPEX - depends on understanding the connection between visual perception and the instigating physical stimulus. 2.6Formative EvaluationTo assess the effectiveness of the LITE materials, we initially developed diagnostic tests consisting of open-ended conceptual questions. Through a systematic study that included multiple rounds of clinical interviews, open-ended written surveys, as well as multiple-choice testing [21], we identified commonly held misconceptions and reasoning difficulties that introductory astronomy students have with concepts relating to: the nature of the electromagnetic spectrum, including the interrelationships of wavelength, frequency, energy, and speed; interpretation of the Doppler shift as an indication of motion; the correlation between peak wavelength and temperature of a blackbody spectrum; relationships between luminosity, temperature, and surface area of a blackbody emitter; and the connection between spectral features and underlying physical processes. Interview questions consisted of the original diagnostic test questions as well as follow-up inquiries to ascertain the depth of student knowledge and/or misconceptions regarding each of those topics. We looked not only at whether students answered questions correctly, but also whether or not they arrived at the correct answers with the proper reasoning. Based on the tests and interviews, average learning gains at BU on the questions ranged from 15% - 20%. 2.7Light and Spectroscopy Concept Inventory (LSCI)Physics Education Research has benefited immensely from the development of the Force Concept Inventory (FCI) (cf. [22]). This 29-item multiple-choice survey is usually administered at the beginning and end of introductory physics courses and has been able to reliably document gains in student understanding of force and motion resulting from various educational interventions. Working with T. Slater and E. Prather (University of Arizona) we have developed a “Light and Spectroscopy Concept Inventory (LSCI) (cf. [21], [23] and [24]). The concept domain addressed by the LSCI has been shaped by the concepts that are most commonly taught in the introductory college astronomy survey courses, such as properties of the electromagnetic spectrum, Doppler shift, Wien’s law, the Stefan-Boltzmann Law and Kirchhoff’s Laws of spectral analysis. The LSCI contains 26 research-based multiple-choice questions that target known student alternate conceptions and reasoning difficulties associated with the selected light topics. The LSCI was administered to approximately 500 students taking introductory astronomy courses at 12 participating colleges and universities in the Fall semester of 2005. We received post-test results for 387 students at 11 of the colleges and universities. Preliminary, but statistically significant, results (cf. [22] and [24]) found that overall learning gains by the BU students using the LITE materials were among the highest of the colleges tested, though part of this result may arise from different pre- and post test sample sizes. We found national pre- and post instruction LSCI averages of 24% and 39%, respectively. This can be compared with pre- and post-instruction national averages of 32% and 47%, respectively, found using the Astronomy Diagnostic Test (ADT) [25]. The LSCI was given to 1500 students at 20 other colleges in Spring 2006. Pre- and post test averages were 25% and 40%, respectively, consistent with the first trial. The combined results are now being prepared for publication [26]. 2.8Presentations and Dissemination of Prototype MaterialsWe have presented the Project LITE outcomes to college scientists and educators, as well as to K - 12 teachers, at meetings of the Optical Society of America, Astronomical Society of the Pacific, American Association of Physics Teachers, American Astronomical Society and American Physical Society. The LITE materials have been used with over 200 teachers in Summer Teacher Workshops at the Exploratorium. They were used with 20 teachers at a Chautauqua teacher workshop, and with 150 university instructors in an ASP Cosmos in the Classroom Symposium. Without exception, the software and materials have been greeted with enthusiasm. All of the software is posted on the LITE web and is freely downloadable. The first six laboratory exercises are being posted on the LITE Web site. Several science education apparatus manufacturers have expressed interest in producing and distributing the LITE kits. 3.Conclusion and Brief Plans For Future Development of Project LITEProject LITE has developed a novel coupling of original software with inexpensive optical materials that can be used in optics education at a variety of educational levels. Though originally developed in response to the need for such hands on and eye-on experiences in introductory undergraduate astronomy courses, these materials can also be used in a wide variety of other educational settings, including K-12 and undergraduate chemistry, physics, Earth Science and psychology courses, as well as in more informal settings. In the future, we plan to expand our development activities to include other input and output devices for computers including printers, webcams and inexpensive USB based photometers. We also plan to develop simple inexpensive devices that can be used to allow students to explore for themselves a wide range of visual phenomena such as depth perception which require other modes of exploration outside the two dimensional realm of computer screens. AcknowledgementsProject LITE is supported by grant # DUE-0125992 from the Division of Undergraduate Education of the U.S. National Science Foundation. ReferencesT. Slater, J. P. Adams, G. Brissenden and D. Duncan,
“What Topics Are Taught in Introductory Astronomy Courses?,”
The Physics Teacher, 39 52
(2001). https://doi.org/10.1119/1.1343435 Google Scholar
M. Zeilik and V. J. Morris-Dueer,
“What are Essential Concepts in Astronomy 101?” A New Approach to Find Consensus from Two Different Samples of Instructors,”
Astronomy Education Review, 3
(2),
(2005). https://doi.org/10.3847/AER2004017 Google Scholar
F. M. Goldberg and L. C. McDermott,
“An Investigation of Student Understanding of the Real Image Formed by a Converging Lens or Concave Mirror,”
Am. J. Phys., 55 108
(1987). https://doi.org/10.1119/1.15254 Google Scholar
R. N. Steinberg, G. E. Oberem and L. C. McDermott,
“Development of a Computer Based Tutorial on the Photoelectric Effect,”
Am. J. Phys., 64 1370
(1996). https://doi.org/10.1119/1.18360 Google Scholar
K. Brecher,
“Do Atoms Really Emit Absorption Lines?,”
The Physics Teacher, 29 454
(1991). https://doi.org/10.1119/1.2343383 Google Scholar
F. S. Crawford, Waves, McGraw-Hill, Inc., (1968). Google Scholar
W. H. Jeffreys and R. R. Robbins, Discovering Astronomy, J. Wiley & Sons, Inc., (1981). Google Scholar
P. Morrison, P. Morrison, J. Pine and J. King, Zap! A Hands On Introduction to Electricity & Magnetism, Jones and Bartlett Pubs., (1995). Google Scholar
R. Chabay and B. Sherwood, Electric and Magnetic Interactions, J. Wiley & Sons, Inc., (1995). Google Scholar
R. Chabay,
“Qualitative Understanding and Retention,”
A.A.P.T. Announcer, 27 96
(1997). Google Scholar
E. Mazur, Peer Instruction: A User’s Manual, Prentice Hall, Upper Saddle River, NJ
(1997). Google Scholar
P. J. Green, Peer Instruction for Astronomy, Pearson Education, Upper Saddle River, NJ
(2003). Google Scholar
K. Brecher,
“Moiré Astronomy,”
Bull. Am. As. Soc., 25
(4), 1436
(1993). Google Scholar
D. R. Sokoloff and R. Thornton,
“Using Interactive Lecture Demonstrations To Create an Active Learning Environment,”
Physics Teacher, 35 340
(1997). https://doi.org/10.1119/1.2344715 Google Scholar
C. H. Crouch, A. P. Fagen, J. P. Callan and E. Mazur,
“Classroom Demonstrations: Learning Tools or Entertainment?,”
Am. J. Phys., 72
(6), 835
(2004). https://doi.org/10.1119/1.1707018 Google Scholar
R. P. Feynman, R. B. Leighton and M. Sands, The Feynman Lectures on Physics, 35
–1 Addison Wesley Pubs., (1963). Google Scholar
K. Brecher and S. Gorlin,
“Snow Motion,”
Journal of Vision, 4
(8), 569
(2004). https://doi.org/10.1167/4.8.569 Google Scholar
K. Brecher and S. Gorlin,
“Snow Motion,”
Perception, 33 159
(2004). Google Scholar
K. Brecher,
“The Red Rectangle: An Astronomical Example of Mach Bands?,”
Bull. Am. As. Soc., 37
(4), 1321
(2005). Google Scholar
K. Brecher,
“Monocular Versus Binocular Perception of Mirror Anamorphoses,”
Perception Supplement, 35 30
(2006). Google Scholar
E. M. Bardar, (Weeks), E. E. Prather, K. Brecher, and T. F. Slater,
“The Need for a Light and Spectroscopy Concept Inventory for Assessing Innovations in Introductory Astronomy Survey Courses,”
Astronomy Education Review, 4
(2),
(2005). https://doi.org/10.3847/AER2005018 Google Scholar
D. Hestenes, M. Wells, and G. Swackhamer,
“Force Concept Inventory,”
The Physics Teacher, 30 141
(1992). https://doi.org/10.1119/1.2343497 Google Scholar
E. M. Bardar,
“Development and Analysis of Spectroscopic Learning Tools and the Light and Spectroscopy Concept Inventory for Assessing Innovations in Introductory College Astronomy,”
Ph.D. Dissertation,
(2006). Google Scholar
E. M. Bardar, E. E. Prather, K. Brecher, and T. F. Slater,
“Development and Validation of the Light and Spectroscopy Concept Inventory,”
Astronomy Education Review, 5
(2),
(2007). Google Scholar
G. L. Deming,
“Results from the Astronomy Diagnostic Test National Project,”
Astronomy Education Review, 1 1
(2001). https://doi.org/10.3847/AER2001005 Google Scholar
E. M. Bardar, E. M.,
“First Results from the Light and Spectroscopy Concept Inventory,”
Astronomy Education Review,
(2007). https://doi.org/10.3847/AER2007019 Google Scholar
|