|
|
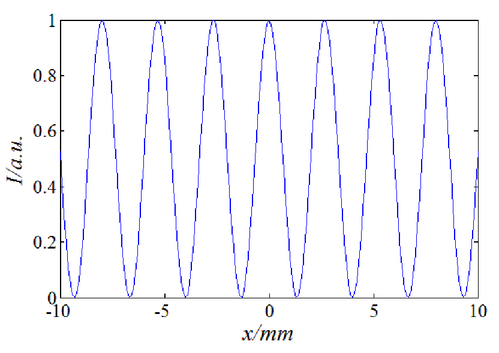
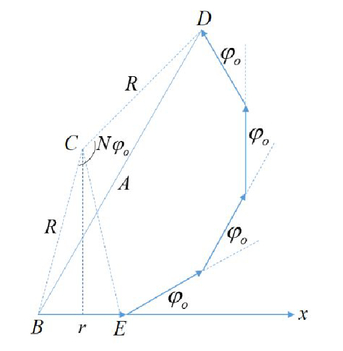
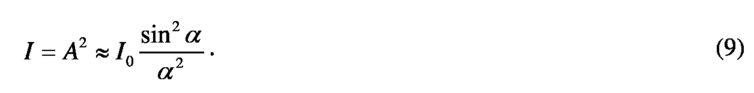
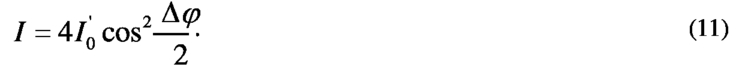
1.INTRODUCTIONIn the course of University Physics, there is an important part, which is Optics. The content is mainly about the wave optics, which has played the important role in kinds of fields, such as interference measurement[1-4], digital microscopic holography[5-9], three-dimensional display[10-12] et al. The content for this part of course is arranged as Young’s double-slit interference, one-slit Fraunhofer diffraction and grating diffraction, which are related with interference, diffraction and interference& diffraction. And the fundamental knowledge is interference and diffraction. Different methods are adopted to analyze. In the view of interference, the optical path difference is calculated, and the relationship is built with the constructive interference and destructive interference. However, half-wavelength band method is applied to describe the one-slit Fraunhofer diffraction. So it seems like they are different from each other. However, in essence they are same on analyzing the redistribution of light intensity, which is caused by coherent superposition. The coherent superposition happens between two or limited light for interference, but infinite sub-light for diffraction. To be precise, if the optical beam obeys the geometrical optics to propagate in straight line, then the superposition is purely about interference, such as Film Interference. Otherwise, interference and diffraction exist in the same time, such as Young’s two-slit experiments. The two concepts are hard for the students to comprehend, because of their abstract character, also knowledge reserve is acquired, such as coherence, optical path, phase et al. Therefore, the demonstrative experiments have been well-developed to show the phenomenon, further for application. For example, Michelson Interferometer is brought to measure the micro displacement, refractive index or thickness of medium, Wedge Film and Newton’s ring are used to test the flatness of the optical elements, and Film Interference is applied to realize reflection reducing and increasing effect. There are also lots of similar simulation work completed by optical software. However, it could be easier for students to understand after they have the idea of the consistency of interference and diffraction. On behalf of this, this paper focus on the typical phenomenon, which is the Young’s two-slit experiment. And analyze the condition for two-slit interference and two-slit diffraction phenomenon to show that interference and diffraction is the same in essence only depending on specific parameters. Simulation by MATLAB and experimental results verify the conclusions. Some paper discuss about this[13, 14], but the experimental parameters are somewhat vague, or mention little about Fresnel diffraction, which would be discussed in this paper. 2.PRINCIPLE AND SIMULATION RESULTS2.1Young’s two-slit interferenceThe schematic of Young’s two-slit interference experiment is shown in Fig. 1. S is one slit, S1 and S2 are two same slits, which are parallel to S and same distance away. The distance between S1 and S2 is d. E is the screen to observe the interference fringes. D is the distance between E and two-slit screen. P is a point on E with coordinate x. The optical path difference between two beams is δ = r2 – r1. Because D is about 104 times larger than d, the angle θ is very small. In the condition of approximation, δ can be described as Eq. (1): And the appropriate phase difference is Δφ, as shown in Eq. (2): λ is the wavelength. The intensity distribution on the screen I is as Eq. (3): and the intensity of the two beams I1, I2 is the same as I0. So I can be simplified as Eq. (4): Here I0 is assumed to be unit as ‘1’. D is 1m, d is 0.2mm, and is 532nm. The profile of the intensity on the screen simulated by MATLAB is shown as Fig. 2. It is like parallel, equidistant, dark-and-light. 2.2One-slit Fraunhofer diffractionFollowing, it is about the diffraction. When one-slit Fraunhofer diffraction is studied, the schematic is described as Fig. 3. The spherical wave produced by point source S is collimated by lens L1. Then go through one slit, which is on K screen, and its size is a. After that, the diffracted beams are collimated by lens L2. The Fraunhofer diffraction pattern shows on E screen. f is the focal length of L1 and L2. θ is the diffraction angle. In order to analyze the intensity distribution on E plane, amplitude vector method is used to obtain the light intensity, shown in Fig. 4. According to Huggens-Fresnel principle, it is assumed that the slit is composed with N subwave point sources, which are distributed evenly. Each subwave has the amplitude r and phase difference between them is φ0. In the triangle BCD, the amplitude of the synthetic vector A can be obtained as Eq. (5): While in the triangle BCE, the amplitude r can be similarly expressed as Eq. (6): So A can be transformed to Eq. (7): Because φ0 is very small, so A can be approximated to Eq. (8): Then the intensity I should be as Eq. (9): I0 = (Nr)2 is the intensity of the zero order, and For the case of one slit, Nφ0 is the maximum phase difference, which is related with the maximum light path difference asinθ. θ is small. So α can be written as Eq. (10): Here I0 is assumed to be unit as ‘1’. a is 2μm, f is 150mm, and λ is 532nm. The profile of the intensity on the screen simulated by MATLAB is shown as Fig. 5. It is symmetrical, and the central intensity is much bigger than surroundings. 2.3Two-slit Fraunhofer diffractionThen, it is about two-slit Fraunhofer diffraction, whose schematic is shown in Fig. 6. a is the size of the slit, b is size of the screen between two slits, and d = a+b The intensity on the screen E is deduced following two-slit interference, which is expressed as Eq. (11): And So I can be described as Eq. (13): I0 is assumed to be unit as ‘1’, Fig. 7The simulated profile of the intensity on the screen of two-slit Fraunhofer diffraction experiment, solid line: two-slit Fraunhofer diffraction, dotted line: one-slit Fraunhofer diffraction.  The essence of the difference between interference and diffraction lies on the parameters. If a is changed from 0.6μm to 0.3μm, 0.1μm, 0.05μm and 0.01μm, while remain others parameters, the profile of two-slit Fraunhofer diffraction seems like alerting to the profile of two-slit interference, as shown in Fig. 8. 2.4Two-slit Fresnel diffractionIt is based on two-slit Fraunhofer diffraction, only the lens behind two-slit screen is taken off, and the schematic is shown as Fig. 9. It is assumed that light with unite amplitude incidents on K vertically, a is 200μm, d is 320μm, D is 115mm, and 532nm. The intensity on screen E is simulated by applying Fresnel diffraction formula, shown in Eq. (14): (x0,y0) and (x,y) are the coordinate on K and E plane separately, φ(x0,y0) is the transmission function of the two-slit, k is the wave vector, and FFT2 refers two-dimensional Fast Fourier transform. When D is 1000mm, the result of Fresnel diffraction is similar as Fraunhofer diffraction, which is described as Eq. (15): Fig. 10 is the simulated results of two-slit Fresnel and Fraunhofer diffraction, which show their differences. The pixel size on E plane (Δx, Δy) can be calculated by Eq. (16): Fig. 10The simulated profile of the intensity on the screen of two-slit Fresnel diffraction and Fraunhofer diffraction. (a) Two-slit Fresnel diffraction, (b) two-slit Fraunhofer diffraction.  (Δx0, 4y0) is the pixel size and N is sampling number on K plane. 3.EXPERIMENTAL RESULTSIn this part, the experimental results are shown in Fig. 11, which are recorded by CCD. The used objects include one-slit with size of 100μm, two-slit with size of 100μm and distance of 160μm, two-slit with size 52μm and distance of 94μm. The propagation distance is around 200mm. They are in agreement on the simulated results, which are the one-slit diffraction, two-slit Fresnel diffraction and two-slit interference separately. The result especially of two-slit interference is far from the expected one, and the reason is that the size of the slit is not small enough and the diffraction efficiency is also low. Fig. 11Experimental results of the intensity on the screen of one-slit diffractioin, two-slit Fresnel diffraction and two-slit interference. (a) One-slit diffraction, (b) two-slit Fresnel diffraction, (c) two-slit interference.  So the new idea is to device a two-slit mechanic element, shown in Fig. 12. The distance between two slits and the size of one slit can be adjusted and measured, which are both 0-1mm and the step is 1μm It can be used to demonstrate the two-slit interference and diffraction phenomenon when alert the parameters continuously. Till now, no company has been found to do this, which is the future work. 4.CONCLUSIONSIn this paper, the principle of two-slit interference, one-slit diffraction and two-slit diffraction is introduced. Also the simulated and experimental results are given. The point is to show the connection between them. When the size of the slit is reduced, two-slit interference turns to two-slit diffraction, whose intensity is modulated by the profile of one-slit diffraction. The difference of Fraunhofer and Fresnel diffraction is also analyzed, applying the knowledge of Fourier Optics. Besides, a new idea of devising an mechanic element of two-slit is presented, and can be an important component of a teaching demonstrative equipment to show the consistency of two-slit interference and diffraction. This paper is helpful for the undergraduates to realize the essence of interference and diffraction, and the equipment based on will be a visual tool to assist. 5.ACKNOWLEDGEMENTThis work is financially supported by the National Natural Science Foundation of China (No. 61475011, 61307010 and 61205010), the Research Fund for the Doctoral Program of Higher Education of China (No. 20121103120003), Science and Technology Project of Beijing Municipal Commission of Education (No. KM201310005031), the Open Project of Beijing Municipal Engineering Research Center (No. Q5024000201301), the Importation and Development of High-Caliber Talents Project of Beijing Municipal Institutions (CIT&TCD201504020), Young Talent Project of Beijing University of Technology, the Fundamental Research Fund of Beijing University of Technology (No. X4024000201501), and the Special Matching Project of Local Supported by Centre. REFERENCESJavidi B., Tajahuerce E.,
“Three-dimensional object recognition by use of digital holography,”
Opt. Lett, 25
(9), 610
–612
(2000). https://doi.org/10.1364/OL.25.000610 Google Scholar
Mir M., Wang Z., Shen Z.,
“Optical measurement of cycle-dependent cell growth,”
PNAS, 108
(32), 13124
–13129
(2011). https://doi.org/10.1073/pnas.1100506108 Google Scholar
Hlubina P., Kadulova M., Ciprian D.,
“Temperature sensing using the spectral interference of polarization modes in a highly birefringent fiber,”
Opt. Laser Eng, 70 51
–56
(2015). https://doi.org/10.1016/j.optlaseng.2015.03.003 Google Scholar
Armendáriz G., Cravioto-Lagos J., Velázquez V.,
“Teaching quantum mechanics with the Hong-Ou-Mandel interferometer,”
in Proc. of SPIE,
928908-1
–7
(2014). Google Scholar
Goodman J. W. and Lawrence R. W.,
“Digital image formation from electronically detected holograms,”
Appl. Phys. Lett, 11 77
–79
(1967). https://doi.org/10.1063/1.1755043 Google Scholar
Kim M. K.,
“Principles and techniques of digital holographic microscopy,”
in SPIE Reviews,
018005-1
–50
(2010). Google Scholar
Kemper B. and Bally G. von,
“Digital holographic microscopy for live cell applications and technical inspection,”
Appl. Opt, 47
(4), A52
–61
(2008). https://doi.org/10.1364/AO.47.000A52 Google Scholar
Colomb T., Cuche E., Charrière F.,
“Automatic procedure for aberration compensation in digital holographic microscopy and applications to specimen shape compensation,”
Appl. Opt, 45
(5), 851
–863
(2006). https://doi.org/10.1364/AO.45.000851 Google Scholar
Miccio L., Alfieri D., Grilli S.,
“Direct full compensation of the aberrations in quantitative phase microscopy of thin objects by a single digital hologram,”
Appl. Phys. Lett, 90 041104-1
–3
(2007). https://doi.org/10.1063/1.2432287 Google Scholar
Teng D. D., Liu L. L., Wang Z. X.,
“Interactive holographic three-dimensional display with a spatial mouse,”
Opt. Commun, 306 121
–127
(2013). https://doi.org/10.1016/j.optcom.2013.04.032 Google Scholar
Hwang Y. S., Bruder F. K., Facke T.,
“Time-sequential autostereoscopic 3-D display with a novel directional backlight system based on volume-holographic optical elements,”
Opt. Express, 22
(8), 9820
–9838
(2014). https://doi.org/10.1364/OE.22.009820 Google Scholar
Kakue T., Tahara T., Ito K.,
“Parallel phase-shifting color digital holography using two phase shifts,”
Appl. Opt, 48
(34), H244
–250
(2009). https://doi.org/10.1364/AO.48.00H244 Google Scholar
Tang Y. L., Hu G., Zhang J.,
“From a double-slits experiment to see the essence of optical interference and diffraction (in Chinese),”
Physical Experiment of College, 24
(3), 35
–38
(2011). Google Scholar
Huang R., Zhang J. X., Liu Z. C.,
“The comparison of double-slit interference and double-slit diffraction based on the MATLAB (in Chinese),”
Physical Experiment of College, 28
(1), 90
–92
(2015). Google Scholar
|