|
|
1.IntroductionComputer simulations are strong tools that support the best knowledge of how an optical network system is operating. In the network simulation environment, the designer has the flexibility to implement different types of system architecture to analyze different layers, such as physical, transport, and higher layer, improving and validating the system for different topologies, node architectures, routing protocols, dates traffic and much more [1][2]. It also allows work to be carried out in different domains, such as access, metro, and core networks. The network simulators in several circumstances save a lot of money and time, and efficiently accomplish optical network system planning. There are currently many network simulators that have different features for different aspects. In this paper, we do not intend to evaluate the performance of network simulators, comparing some of the simulators to get the best. We just want to present the existence of these tools and show that they can be used to support the development of a network project. For transport layer simulation, we include a short list of some of the network simulators they are: OPNET, NS-2, NS-3, OMNeT++, REAL, SSFNet, J-Sim, QualNet, MatPlanWDM, etc. Some of those network simulators are commercial, and others are open source. Both can offer advantages and disadvantages. For physical layer simulation we have a number that are freely available (FOCSS developed at TRLabs, LIGHTSIM by Softronix Software, SIMFOCS developed by Dr. Geckeler) and are commercially available (ModeSYS by RSoft, OptiSYSTEM by Optiwave, OptSim by RSoft, PHOTOSS distributed by P. I. Systemtechnik Jens Lenge, VPItransmissionMaker™ [3-5]. These packages include extended libraries of photonic components for the transmitter, communication channel (fiber/waveguide), amplifier, receiver and extensive output parameter capabilities. With the tools above, the designer can analyze many important network parameters and output characteristics, such as eye-diagram calculations, BER evaluations, blocking probability, latency, and delay that are readily available and can be directly compared to experimental data. Importantly, many individual physical and transport effects and system components can be modified or turned on and off independently in numerical experiments, thus enabling the designer to develop an insight into the impact of various effects on overall system performance, a feature usually unattainable in real experiments. In this present work, we evaluate the performance of a Wavelength Division Multiplex (WDM) network considering two different photonic switching technologies: Optical Packet Switching (OPS) and Optical Circuit Switching (OCS) [6]. Firstly, physical layer planning was completed to compensate for the attenuation, dispersion effects, and wavelength distribution using theoretical analytical calculus. Afterward, the main network parameters used to compare the performance of photonic switching were obtained with the simulation tools Matlab, ONSim and VPItransmissionMaker™. Thus, the main parameters obtained and analyzed were the blocking probability on transport layers, and bit error rate (BER) on the physical layer. The work is organized as follows. In Section 2, we present the theory and the basic concepts. In Section 3, we propose resource distribution planning to improve the blocking probability and bit error rate. In Section 4, methodology and dynamics for simulation scenarios are presented. Finally, in Sections 5 and 6 we present the results, comments, conclusions, and the perspective of future works. 2.Analytical calculusOptical systems require careful investigation on the theoretical performance against various impairments caused by either electronics or fiber dynamics before they are deployed in practice [6-8]. Thus, the analytical modeling and the simulation test-bed of optical systems are necessary for the investigation and verification of the proposed optical system’s behavior. In this work, physical network planning to reduce the linear and nonlinear effects of the signal transmission is proposed, as well as, resource distribution planning for the transport layer, improving the blocking probability of the signals with wavelength distribution and the BER. This section presents the analytical model adopted for the physical and transport planning. A.Physical LayerThere are several heuristics that consider compensating the physical impairments through routing [8]; however, our proposal is to realize pre-planning of the physical layer based on the topology information, such as average length of span and average length of shortest path. Thus, we can choose the proper optical devices, according to topology. The design is aimed to offer a simple architecture that provides amplification of the signal and compensates for the sources of signal degradation in a fiber link transmission. The dynamics of an optical fiber transmission are governed by the combined action of attenuation, chromatic dispersion, and nonlinearities, as those are related to the transmission distance and system power [6-8]. Therefore, the physical planning is done applying the calculation of these parameters, such as attenuation, dispersion, estimating ASE noise, and controlling the nonlinear impairments. The calculation of the main parameters for a single span begins with equations (1) and (2), which are applied to obtain the maximum allowed transmission distance (Dmax) for a signal, limited by attenuation (a) and by dispersion effect (dSSMF) [6]. Where we have the input power (Pin), the light velocity (c), and the bit rate (B). The signal degradation caused by the attenuation and the dispersion can be reasonably solved with the application of Erbium Doped Fiber Amplifiers (EDFAs) and with a dispersion compensating fiber (DCF), but an ASE noise is also added to the signal, degrading the OSNR. The EDFAs’ power must be controlled, to reduce ASE noise. When the spans length (LSSMF) is limited for attenuation, meaning that LSSMF > Dmax, the solution is to amplify the signal in the span link. The calculation to obtain the number of the amplifier (Na) in each span link and the gain (Ga) for each amplifier is given by the following equations (3a and 3b), To compensate for fiber chromatic dispersion, when LSSMF > Dmax(dssMF), a dispersion compensating fiber DCF is considered, and the length necessary for the fiber can be calculated with equation (4). Where dSSMF and dDCF are the SSMF and DCF span dispersion. It is essential to add another amplifier to compensate for the attenuation of the DCF and the equation to calculate that is the same as shown in equation 3b. The photodetectors are considered to receive signals with the same sensitivity adopted in the literature [9]. The receiver’s sensitivity is set to maintain a Bit Error Rate (BER) value better than 10e-9. This error rate depends of course on the SNR at the receiver. The system error rate requirements and the receiver noise levels thus set a lower limit on the optical signal power level that is required at the photodetector. A system that applies coherent detection allows a higher sensitivity and better noise control, especially in higher transmission rates (above 40Gb/s); however, the discussion of this technique is beyond the scope of this work. B.Transport LayerThe analytical model adopted for the transport layer assumes that the total capacity of the networks is given by the sum of the separate capacities of each link. This has been assumed previously in [10] for uniform, regular mesh networks of grade k and links with the same size, where For topologies with different link lengths and different node grades, the average number of hops (
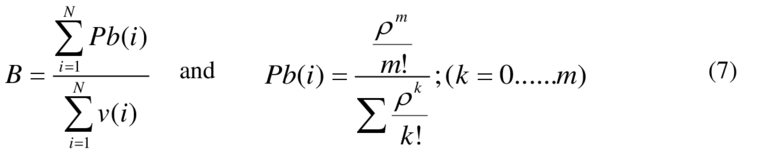
where Lij are the links of the network topology connecting nodes labeled i and j. The parameter lambda (λ), which represents the wavelengths or channels offered for each link in the WDM network, is necessary. The calculation of increase latency in an uncontrolled way since every packet must wait for the availability of the shortest path. Both SF- When the Deflection Routing (DR) protocol is used, no buffering is needed, and optical packets/bursts are immediately forwarded to any out-port available. The calculation of Another significant parameter analyzed in this work is the blocking probability B [12], which stands for the number of packets that do not arrive at their destination due to the lack of available network resources. It is obtained by calculating the probability of packets blocked at node (i), Pb(i), and divided by the total number of packets visiting the node (i), v(i), and N is the number of nodes as in equation 7. Then the total blocking probability in the network can be obtained using, In equation (7), the blocking probability [12] is calculated for each node (i) considering the total visited packets in each node separately v(i), thus the total blocking probability is obtained by summing over all nodes. The probability Pb(i) can be obtained considering the well-known Erlang-B formula (below) and calculated assuming a network system with m servers (channels), no waiting line and Poisson traffic with arrival rate = R, service rate (per server) = µ. The traffic intensity load considering all servers busy is ρ = R/µ. 3.Optical Network PlanningNetwork planning is defined by the knowledge of some network parameters that enable the estimation of QoS, QoT (quality of service/transport), and by the cost of the information transmission and transport. Thus, it is important for efficient planning to evaluate physical characteristics, topologies, and network performance, as well as overall efficiency. This section focuses on analyzing topology parameters and some physical constraints that impact the signal transport and transmission quality. These analyses are meant to support a more accurate resource distribution, thus reducing effective resources without necessarily impacting on the performance of the signal transport. Logical and physical topologies and the lengths of links generally characterize networks. This data is used to obtain other parameters – for convenience the German Optical Network (GON) has been adopted (Fig. 1). Given a network topology, it is possible to calculate the average node degree, the average size of links, the average number of hops, the average distances, and the network’s diameter. These calculations will be applied to a schematic simulation to distribute network resources (number of lambdas and amplifiers) efficiently, to define transmission rate, connection times, the amount of packets/circuits and the routing algorithms in the simulation planning. In Fig. 2 the statistic results show the required average utilization of outputs for each node respectively. These results show which nodes and links outputs are the most and least used. Note that x-axis of Fig. 2 is not clear due to the high amount of links, the elements of the x-axis stand for all link connections of GON topology; i.e. node 1 has link connections (1,6); (1,7); (1,10), node 2 has (2,13); (2,6); (2,7). The resource distribution method adopted for the wavelengths’ assignment is based on considering more wavelengths for more-used paths (more signal transport). Since the total amount of wavelengths per link available is fixed, the strategy adopted was to balance the distribution of wavelengths proportionally to each link’s usage, offering lambdas to adjust the actual demand for each link (Fig. 3) [13]. Table 1 shows the results used to calculate the attenuation and dispersion of each network link. These values will be used for the physical layer planning of the simulated network model. Thus, the modeling was done for each fiber link according to its impairments. In these calculations, we considered Standard Single Mode Fiber (SSMF) type, line width of laser 0.1nm (Δλ), spectral band (λ≈1550nm), attenuation constant (α) of 0.2 dB/Km, and dispersion constant (d) 17ps/nm km. Table 1:Parameters for link dimension (* Semiconductor photodiodes p-i-n photodiode)
With equations (1) and (2), we can obtain the maximum transmission length for each link building a network that is limited by attenuation length La and dispersion of signal Ld, [6]. The calculation to obtain the total number of amplifiers (Na) per link is obtained using equation (3). With the values of table 1 and equations (1-3), we can estimate if each of the links in the network need to use amplifiers and DCF to satisfy the impairments of signal dispersion and signal attenuation of Table 2. Table 2:Parameters for link dimension
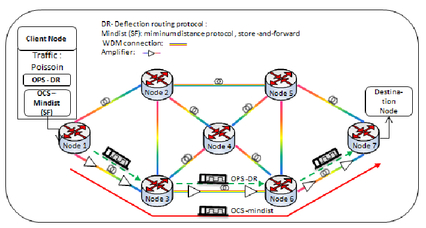
The photodetector sensitivity considered to obtain the values of table 2 is the one used in the reference [9], as mentioned before. With values of table 1, we can see that the use of amplifiers is needed in all scenarios. The system that applies coherent detection allows sending weaker signals with performance model format and less thermal noise in higher transmission rates (greater than 40Gbs), although coherent detection technique is expensive and is out of the scope of this work. 4.Network Configuration and Traffic ModelsThis section presents the procedures and conditions considered in the simulations performed for the transport network and the physical network. Fig. 4 presents a diagram of the simulation dynamics for both WDM-OCS and WDM- OPS techniques evaluating the physical layer as well as the transport layer. In routing, the shortest distance (called Mindist or SF) was adopted for the OCS while Deflection Routing was adopted for the OPS. The network topology model uses bidirectional links, and the traffic is modeled assuming a Poisson distribution. The optical packets have a fixed-size of 500 bytes. The minimum transmission rate is 10 Gbits/s, an acceptable transmission for today’s metropolitan environment. The number of requests generated is around 1e6, which is the number of Optical Circuits or Optical Packets generated per node. The software utilized for the simulations and analyses in this transport layer was OniSim and Matlab [3-4]. The physical layer was configured based on the parameters of tables 1-2 and Fig. 1, the amplifier (EDFA) and DCF were configured for a fiber span length of 70 km. The VPItransmissionMaker™ [5] tool was used for physical layer simulation. 5.Results and DiscussionThe main results were obtained to analyze the blocking probability and the delay on the transport layer level of WDM-OPS/OCS systems using the GON network topology shown in Fig. 1. The blocking probability and the BER parameters were evaluated to validate the network structure considered in our work. The simulation results considered networks with links of 1, 2, 4, 8 and 16 channels (except for Figs. 11-13, in which we considered links with 8 and 16 channels) and transmission rate of 10 Gb/s according to actual metropolitan environments. A.Simulation results for network performance evaluationIn Fig. 5, we can observe that the total blocking probability for both modes of switching (OCS and OPS) is similar: the values are almost the same for each independent wavelength and, obviously, the blocking probability for links with 16 wavelengths is smaller than the one for those with 8 wavelengths. For this result, resource distribution planning was not considered. It is important to note that OPS with DR routing achieves approximately the same values of blocking probability than those with the use of OCS-SF, but with the advantage that the node architecture for OPS-DR is bufferless. On the other hand, for OCS-SF a buffer is always required which increases the network latency and overall costs while decreasing the effective capacity utilization. Fig. 5:(a) Blocking Probability – WDM-OCS/Mindist and WDM-OPS/DR; (Without resource distribution planning)  Fig. 6 presents the blocking probability applying the resource distribution planning proposed in section III. In these results, the average number of wavelengths per link was fixed at 8 and 16, and the wavelengths were allocated to each link considering how many times each link was utilized (Fig. 2). Fig. 6:(a) Blocking Probability – WDM-OCS/SF; (b) Blocking Probability – W DM-ol’S DR (With and without resource distribution planning)  It can be seen that with the resource distribution planning the blocking probability improves (i.e. decreases) for both switching modes, but the OPS mode has a higher impact. Comparing both results (Figs. 6 a & b), it is clearly seen that the performance of resource distribution planning has a better impact on OPS than on OCS. The results shown in Fig. 7 show the BER as a function of distance. The BER limit for these conditions was satisfied for both switching and routing (OPS and OCS). We observe that in the limit of the network diameter, a coherent detection would be recommendable (or necessary) 6.ConclusionIn this paper, we have investigated the performance of OPS/OCS switching employed in WDM networks with the German topology. Through analytical and simulation results, it was possible to evaluate and compare these two types of photonic switching adopting DR and SF as protocol routing. We have also proposed network planning based on the wavelengths distribution and amplifiers allocation in the links to improve the packets blocking probability and ensure optical signal quality through the control of physical impairments such as attenuation, dispersion, cross-talk, and ASE noise. Thus, the network in which the path length affects the optical signal quality amplifiers were added. The analytical and simulations results of WDM-OPS switching with DR protocol indicate that this combination can be a very good solution for data traffic in metropolitan networks, offering efficient network capacity utilization through the improvement of blocking probability. Future work in capacity distribution planning should analyze parameters, such as power consumption and resource distribution planning to minimize the number of wavelengths utilized without a reduction in the quality of transmission. 7.AcknowledgmentsThis work received financial support from CNPq and CAPES agency (Conselho Nacional Desenvolvimento Científico e Tecnológico – Brazil). 8.8.References,WAN simulators and emulators, http://www.cse.wustl.edu/~jain/cse567-08/ftp/simtools Google Scholar
Chekuri, Lisa,
“Design tools for transparent optical networks,”
Bell Labs Technical Journal, 11
(2), 129
(2006). https://doi.org/10.1002/bltj.20165 Google Scholar
P. Pavon-Marino, R. Aparicio-Pardo and J. Veiga-Gontan,
“MatPlanWDM: An Educational Tool for Network Planning in Wavelength-Routing Networks,”
in Proceedings of the 11th International Conference on Optical Networking Design and Modeling, ONDM 2007,
58
–67
(2007). https://doi.org/10.1007/978-3-540-72731-6 Google Scholar
GroupONSim,
(2012) http://professor.ufabc.edu.br/~luiz.bonani/projects/ONSim.html Google Scholar
G. Agrawal, Fiber-Optic Communication Systems, 3rdJohn Wiley, New York
(2002). https://doi.org/10.1002/0471221147 Google Scholar
R. Ramaswami, K. N. Sivarajan,
“Optical Networks: a practical perspective,”
3rdMorgan Kaufmann, Academic Press, Boston, USA
(2010). Google Scholar
S. Azodolmoky, M. Klinlowski, E. Marin, D. Careglio, J. S. Pareta, I. Tomkos,
“A survey on physical layer impairments aware routing and wavelength assignment algorithms in optical networks, Journal Computer Networks: The International Journal of Computer and Telecommunications Networking,”
53 926
–944
(2009). Google Scholar
M.S. Anuar, S.A. AlJunid, A.R. Arief, M.N. Junita, N.M. Saad,
“PIN versus Avalanche photodiode gain optimization in zero cross correlation optical code division multiple access system, Optik - International Journal for Light and Electron Optics,”
124
(4), 371
–375
(2013). Google Scholar
I. B. Martins, F. Rudge Barbosa, L. H. Bonani and E. Moschim,
“Contribution to future metropolitan access network planning considering link failures in photonic switched networks,”
PNET - Photonic Network Communications, 24
(3), 187
–197
(2012). https://doi.org/10.1007/s11107-012-0379-6 Google Scholar
A. S. Acampora and S. I. A. Shah,
“Multihop lightwave network: a comparison of store-and-forward and hot potato routing,”
IEEE Trans. Communications, 40
(6), 1082
–1090
(1992). https://doi.org/10.1109/26.142798 Google Scholar
Eric W. M. Wong, Jayant Baliga, Moshe Zukerman, Andrew Zalesky, and Garvesh Raskutti,
“A New Method for Blocking Probability Evaluation in OBS/OPS Networks With Deflection Routing,”
J. Lightwave Tech, 27
(23),
(2009). https://doi.org/10.1109/JLT.2009.2031123 Google Scholar
Martins, I.B.; Perez-Sanchez, G.; Gallion, P.; Rudge, F.; Moschim, E.,
“Performance of WDM networks with photonic switching and resource distribution planning,”
in Network and Optical Communications (NOC), 2013 18th European Conference on and Optical Cabling and Infrastructure (OC&i), 2013 8th Conference on,
241
–248
(2013). Google Scholar
|