|
|
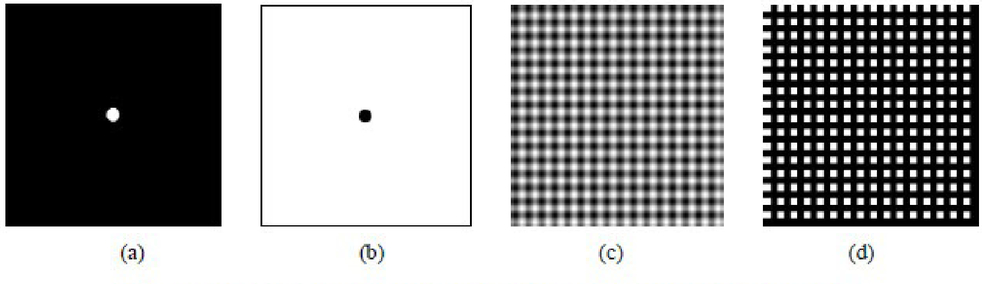
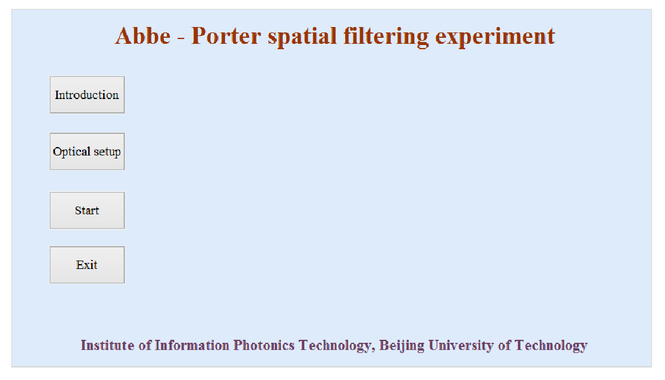
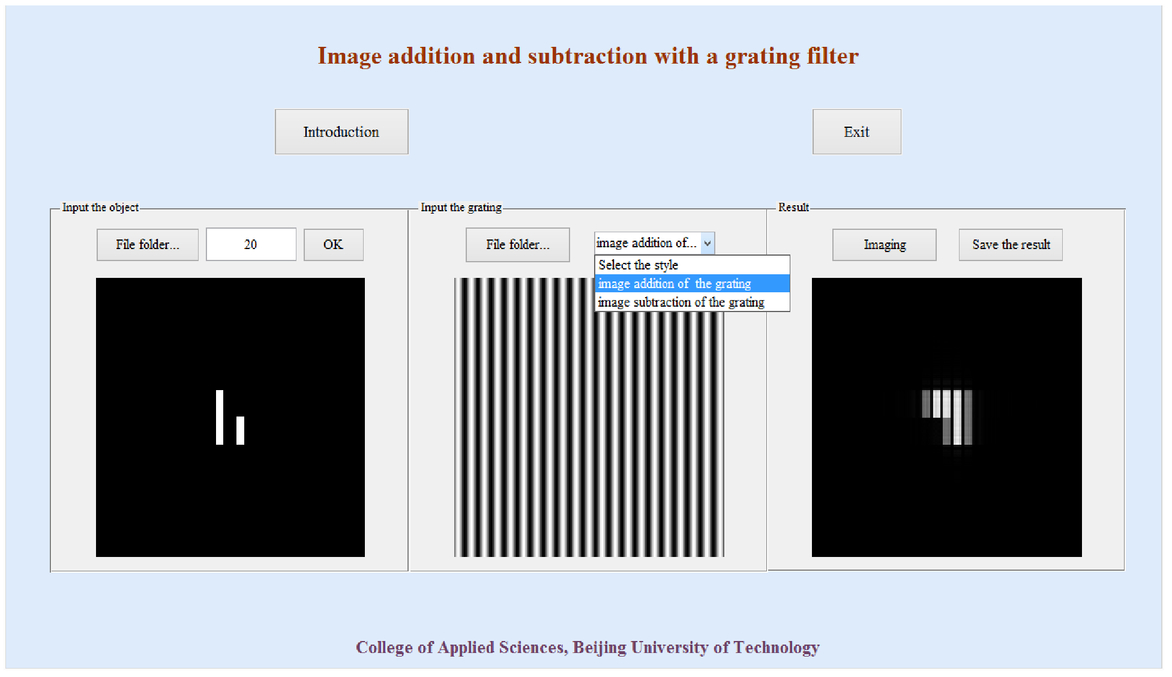
1.INTRODUCTIONSpatial filtering based on the principle of Abbe imaging is a kind of optical information processing method, which uses the concept of Fourier spectrum to analyze the distribution of object wave field, and employs the specific design of the filter to change the spectrum structure of the target to generate the expected imaging[1]. The purpose of spatial filtering is to improve the image quality, including the removal of high frequency noise and interference, and the image edge enhancement, linear enhancement and deblurring, and so on. Spatial filtering can be performed by the ways of optical filtering and digital filtering process. It is widely used in military recognition, industrial automation and medical diagnosis[2]. In this paper, the simulation experiments both of Abbe-Porter spatial filtering and of optical processing of image addition and subtraction with a grating filter are designed and achieved. We realize the design and operation of optical information processing simulation experiments based on information optics theory and the experimental principle by using MATLAB, and the experiment process is demonstrated step by step. The results show that the simulation processing can make the optical information more effective, because of the reasonable design of the experiments and the simplified operation process. These developed virtual experiments have been used in experimental teaching for undergraduate students majored in optics or optical engineering, which effectively assist students to understand concept and principle of optical information processing. 2.THEORY OF SPATIAL FILTERING2.1Principle of Abbe-Porter imaging and spatial filteringBased on the principle of Abbe imaging, the object wave is deemed as a group of different spatial frequency information, and the coherent imaging process of a target object is typically achieved in two steps. In the first step, the spatial frequency spectrum is generated on the spectrum plane by Fraunhofer diffraction of the object wave, and in the second step, the image of the target can be constructed on the image plane by coherent superposition of the subwaves emitting from the spectrum plane, which represent different spatial frequency, [3]. The two steps means twice operations of Fourier transform. If these operations are ideal completely, the obtained image without any lose is exactly similar as the object[4]. In Abbe imaging experiment, 4f optical system is one of the most classic configuration in optical information processing[5]. Figure 1 shows the imaging process of 4f system. The object plane P1 (x, y) is located on the front focal plane of the Fourier transforming lens L1, the spectrum plane P2 (u, v) is located on the back focal plane of the L1, which is also on the front focal plane of the L2, the image plane P3 (x′, y′) is located on the back focal plane of the L2. Furthermore, the focal length of lens L1 is equal to that of lens L2. In this experiment, the specific design of the filter is employed on the spectrum plane to change the spectrum structure of the target to generate the expected imaging. Fig. 1The schematic diagram of 4f imaging system. P1: object plane; P2: spectrum plane; P3: image plane; L1, L2: lens; A, B, C: object; S-1, S0, S+1: spatial frequency; A′, B′, C′: image 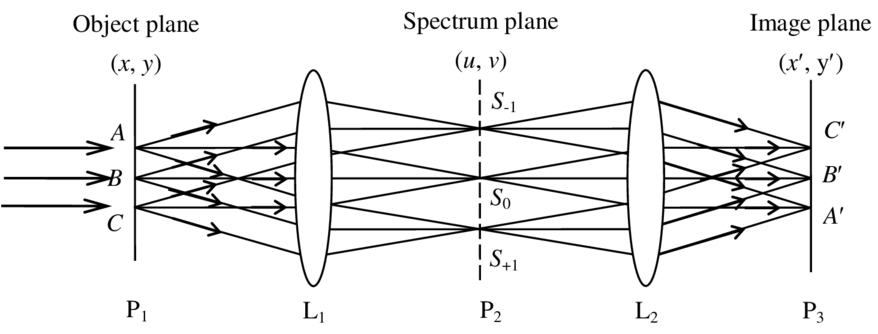 The transmittance function of a one-dimensional grating, t(x), is expressed as follows Where d is the grating constant, a is the width of the silt, L is the total width of the grating. If the filter is a through-hole that allows zero-order spectrum to pass, the wave field distribution on the image plane is given as follows Where H(fx) is the transmittance function of the filter. If the filter is a slit which allow the zero-order, the order +1 and the order -1 spectrum to pass, the optical field distribution on the image plane is given as follows If the filter is an opaque circular screen which can filter out the zero-order spectrum, the optical field distribution on the image plane is given as follows 2.2Principle of image addition and subtractionIn this experiment, the spatial filter is a Ronchi grating, and the experiment setup consists of a 4f optical imaging system. Figure 2 shows the experimental configuration of image addition and subtraction with a grating filter. Lens L2 is a transform lens, lens L3 is imaging lens, and the focal length of the lens L2 is equal to that of the lens L3. The object plane (x1, y1) is located on the front focal plane of the lens L2, the frequency plane (x2, y2) is located both on the back focal plane of the L2 and on the front focal plane of the L3, the image plane (x3, y3) is located on the back focal plane of the L3. Fig. 2The schematic of the image addition and subtraction with a grating filter. A, B: object; (x1, y1): object plane; (x2, y2): frequency plane; (x3, y3): image plane; L2, L3: lens; f: focal length 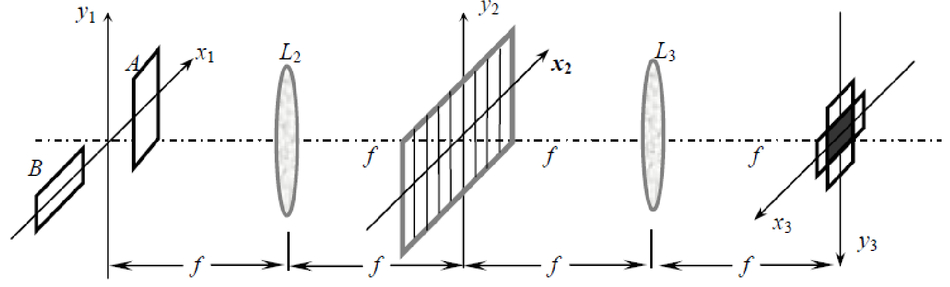 The samples are image A and B, the center coordinates of them are (b, 0) and (-b, 0), respectively. When the plane wave with the wavelength λ illuminates the object vertically, the complex amplitude distribution after the object The grating of spatial frequency ξ0=b/λf is placed onto the spectrum plane. The complex amplitude transmittance function is given as where φ0 denotes the initial phase of the grating. Thus, the wave field distribution on the image plane is described asIf the initial phase of the grating φ0=π/2, image subtraction is performed. If the initial phase of the grating φ0=0, image addition is achieved. 3.SIMULATION EXPERIMENTAL RESULTS3.1Abbe-Porter spatial filteringIn the Abbe-Porter spatial filtering experiment, the object is generated by MATLAB program. According to Eq. (1), the parameters both on the x and y direction can be given with pixel number as a=16pixels, d=32pixels, and L=512pixels. Figure 3(a) shows the pattern that is input onto the object plane as a target object, and figure 3(b) shows the spatial frequency of the object. The zero-order spectrum, the order +1 and order -1 spectrum are zoomed in (seen as in red rectangle). The simulation of the filters and imaging results are shown in figures 4(a) to 4(d) and figures 4(e) to 4(h), respectively. When the filter is a transparent screen shown in figure 4(a), the whole spatial frequency of the object is passed through completely. The imaging result is given in figure 4(e). When the filter is a horizontal slit of figure 4(b), the image on the image plane after spatial filtering is of vertical stripes as shown in figure 4(f). If the filter is a vertical slit in figure 4(c), the spatial filtering result on the image plane is of horizontal stripes as shown in figure 4(g). When the filter made of a slant slit at an angle 45° shown in figure 4(d) is used, the spatial filtering result on the image plane is a pattern of slant strips with angle -45°, shown in figure 4(h). Fig. 4The filters and imaging results by filtering. (a) - (d): filters; (e) - (h): the imaging results with respective to through the filters in (a) - (d)  The filter that blocks high frequency components to pass through is referred as low pass filter. It is typically used in noise reduction of digital images. On the other hand, the filter stopping low frequency components is referred as high pass filter, which is used to sharpen the image that is helpful to observe the details. In figure 5(a), the low pass filter allows the zero-order, the order +1 and the order -1 spectrum of the target to pass through the system. The imaging result is some blurry as shown in figure 5(c). With a high pass filter that can filter off the zero-order spectrum, shown in figure 5(b), the image with opposite contrast is formed as in figure 5(d). 3.2Image addition and subtractionIn the virtual experiment of image addition and subtraction with a grating filter, the object is generated by using MATLAB program, shown as in figure 6(a). The window size loading the image is 512×512 pixels, the distance between images A and B is 40 pixels, the width each of two rectangles are 15 pixels. Fig. 6(a) The object in the virtual experiment of image addition and subtraction; Simulation of image addition and subtraction, (b)and (c): the grating filter and the result of image addition; (d) and (e): the grating filter and result of image subtraction.  According to formula (7), when the initial phase φ0=0, the generated grating is shown as in figure 6(b). As a result, image addition is achieved on the coincident position of the diffraction images, shown in figure 6(c). When φ0=π/2, the generated grating is shown in figure 6(d), and thus, image subtraction is realized on the coincident position of the diffraction images, shown in figure 6(e),. 4.THE OPTICAL SIMULATION SOFTWARE INTERFACEIn this paper, the optical spatial filtering simulation teaching software is designed and performed by using MATLAB, and the spatial filtering process is demonstrated step by step. The main interface of Abbe-Porter spatial filtering experiment is given in figure 7. It consists of the control bars of ‘Introduction’, ‘Optical setup’, ‘Start’ and ‘Exit’, which can perform the procedures of the virtual experiment. After clicking the button ‘Start’, the virtual experiment interface is opened, which is shown as in figure 8. The experiment interface consists of three functional portions to control and display, including the functional modules of “Input the object”, “Input the filter”, and “Result”. The size and pattern of the object, the size and shape of the filter are assigned or selectable in menu options, seen the example in the module “Input the filter”. The main interface of image addition and subtraction with a grating is given in figure 9, which can also perform the virtual experiment similar as that in Abbe-Porter experiment. After clicking the button ‘Start’, the experiment interface is opened, as shown in figure 10. The experiment interface consists of three functional portions to control and display, including the functional modules of “Input the object”, “Input the filter”, and “Result”. The distance between two rectangles as objects A and B and pattern of the object are assigned or selectable, and the gratings matching with image addition and subtraction are selectable in menu options, seen the example in the module “Input the grating”. 5.CONCLUSIONSIn this paper, the simulation both on the experiment of Abbe-Porter spatial filtering and the experiment of optical processing of image addition and subtraction with a grating filter is achieved in the virtual experiment interfaces. Based on the principle of information optics, the process of spatial filtering is operated by using MATLAB program. We realize the design of the optical spatial filtering simulation user interface, and the experiment process is demonstrated step by step. The results show the consistency with the theory. The virtual optical experiments are much more flexible and the results more complete to explain fundamental issue. The virtual experiments are also helpful for the filter’s design and the image processing. The developed virtual experiment software has been used in experimental teaching of undergraduate students majored in optics or optical engineering, which effectively assist students to understand concept and principle of optical information processing. REFERENCESJoseph W. Goodman,
“Introduction to Fourier Optics,”
Electronic Industry Press, Beijing
(2011). Google Scholar
Xia Yuan, Jingjing Wang, Huayang Jin,
“Improvement of Abbe – Porter principle of image formation and spatial filtering experiment,”
Physics experimentation, 30
(3), 4
–6
(2010). Google Scholar
Naiguang Lu,
“Fourier optics,”
China Machine Press, Beijing
(2006). Google Scholar
Zhefang Peng,
“Applications of digital image processing in experiment of Abbe imaging principle and spatial filtering,”
Physics experimentation, 21
(7), 26
–28
(2001). Google Scholar
Baigen Pan,
“Information optics simulation software for research,”
Heifei university of technology, 20
–21
(2010). Google Scholar
|