|
|
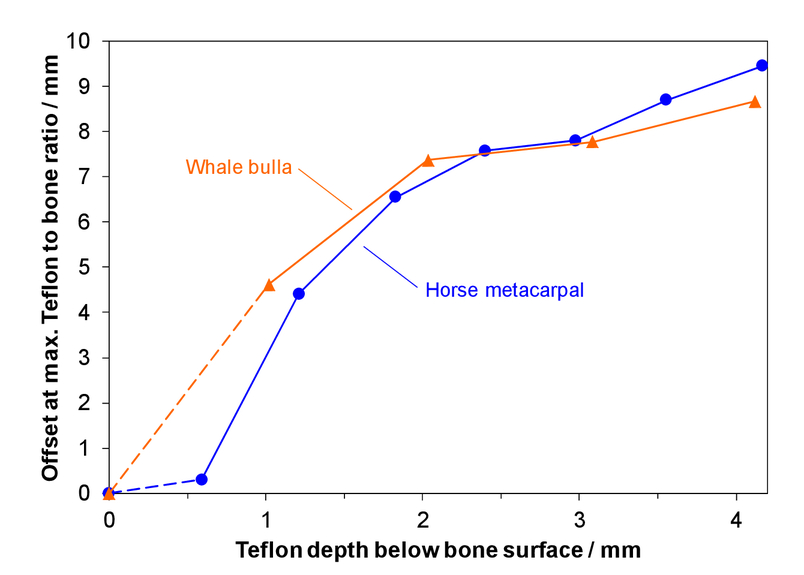
1.INTRODUCTIONThe early identification and effective management of bone disorders and diseases is a growing challenge in aging populations. To address this issue optimally, more effective diagnostic and therapeutic solutions are required. In particular, early diagnosis of various bone conditions is the key to enable efficient early treatment before irreversible tissue damage and loss takes place. Such technological advances are driven by the need to improve life quality of patients and reduce societal healthcare costs. To date the X-ray based technique dual-energy X-ray absorptiometry (DXA) is the standard method to assess mineral density in bone tissue. However, bone is a complex hierarchical composite material typically containing 55-65 % mineral, about 30 % collagen and 5-15 % water. As DXA is only sensitive to the mineral component, and cannot probe the organic (collagen) phase, the technique only takes into account about two third of the total bone composition. This is a major drawback as it has been shown that collagen plays an essential role in determining the structural properties of the bone matrix.1,2 In addition, ionizing radiation can become an issue if radiation exposure accumulates after numerous scans (not uncommon to monitor the effects of pharmaceutical treatment of bone conditions, as e.g. bisphosphonates prescribed in the case of osteoporosis). Raman spectroscopy has been used successfully to obtain chemically specific information from both phases of bone tissue (mineral and organic). However, in its conventional form the technique is limited to the sample surface and thus only applicable to excised bone sections. This drawback can be overcome using spatially offset Raman spectroscopy (SORS), which allows for sub-surface probing and has a great potential to become an in vivo tool for the non-invasive detection of various bone conditions. Transcutaneous bone characterization using SORS to identify potential markers for bone disease is currently a very active research area.2-5 The bone volume probed by SORS is dependent on photon scattering inside the specimen, which is determined by its optical properties. Initial photon migration investigations on cortical bone have been conducted by our group to assess the effects of different spatial offsets on the interrogated sample depth.6,7 Understanding and taking into account the natural variations in diffuse scattering properties of various bone types is essential for the effective development and optimization of SORS as a diagnostic in vivo tool for characterizing bone diseases. In extension of our previous studies this paper thus presents SORS depth investigations on two selected types of bone tissue with very different material properties. An equine metacarpus was used as an example of a typical long bone and is compared with a whale bulla that represents one of the most mineralized bones found in nature. 2.MATERIALS AND METHODS2.1Spatially offset Raman spectroscopy systemA custom built SORS system form Cobalt Light Systems Ltd., Oxfordshire, UK has been applied to perform the Raman investigations. The device operates at 830 nm to exploit low absorption of biological tissue in this spectral region. An optical power of 330 mW is delivered to the sample surface and spectra are collected in back-scattering geometry. Using the inverse SORS concept8, annular laser illumination zones with selectable radius determine the spatial offset while the Raman signal was collected from a fixed zone in the center of the illumination ring. Spatial offsets between excitation and collection areas in the range between 0 mm and 8 mm were used for the photon migration study. Raman-scattered radiation emerging from the central collection zone on the sample surface (diameter: 1 mm) was imaged into a low-loss Optran WF fiber bundle (CeramOptec, East Longmeadow, MA) and transferred to the spectrometer. The back-scattered light was then spectrally dispersed onto a spectrograph (Raman Explorer, Headwall, MA) and recorded by means of a CCD detector (Andor iDus 420 BR-DD; Andor, Belfast, Northern Ireland). More detailed information about the SORS system can be found in our earlier publications.9,10 2.2Bone samplesA section with a length of 4 cm was cut from the metaphysis (the end) of an equine metacarpus. The cutting direction was perpendicular to the long axis of the bone.6 From that section seven thin slices with thicknesses of 0.6 mm each were cut along the long axis of the bone using a bandsaw. In the case of whale bulla the bone was cut in half at the center with the cutting direction perpendicular to the long axis of the bone (solid blue line in Figure 1, top left). Using the same cutting direction, slices with individual thickness of 1.0 mm (limited by the brittleness of bone material) were cut by means of a bandsaw (dashed blue lines in Figure 1, top left). Figure 1.Photographs of whale bulla bone with lines indicating cutting direction of slices (top left), cut slices and bone segment (right) and scheme of measurement arrangement (bottom left).  In both cases individual slices were put together forming a stack of 4 layers (whale bulla) and 7 layers (horse metacarpal) with a total thickness of ca. 4.1 mm and stacks were put on top of the corresponding bone segment (see Figure 1, bottom left). To investigate from which depth inside the bone tissue the detected Raman signal originates a 0.38 mm thin Teflon slice was used as test sample and inserted in between layers of stacked bone slices at different depths. For each depth three lateral positions were probed with spatial offsets ranging from 0 mm to 8 mm using 30 s measurement time each. Raman intensity ratios were calculated using the most prominent bands of bone at 961 cm-1 and Teflon at 733 cm-1. 2.3Transport length estimationTo estimate the light transport lengths of the different bone samples light transmission measurements were conducted. The collimated beam of an 830 nm laser (Model Lynx, Sacher Lasertechnik) was directed onto the sample which was placed immediately behind the laser output aperture. Light intensity transmitted through the bone material was measured using a power sensor (S121B, Thorlabs Ltd.) in conjunction with an optical power meter (PM30, Thorlabs Ltd.). The detector with an aperture diameter of 9.5 mm was aligned to the optical axis and placed 1 m away from the bone sample. First, the reference intensity (I0), i.e. without bone in the beam path, was recorded. Subsequently, individual bone slices (thickness l) were placed behind the laser output aperture and the transmitted power (I1) was recorded. Measurements were repeated for 3 different lateral positions for each slice. As light absorption is negligible compared to scattering in the applied wavelength range, the transport length (lS*) can be estimated using equation 1. This relation can be easily derived from the Beer-Lambert law taking into account that the total extinction coefficient μ is almost equal to the scattering coefficient μs and further assuming a pronounced forward scattering within the bone tissue (mean cosine of scattering angle g = 0.9).11 3.RESULTS AND DISCUSSION3.1SORS signal recovery of a concealed Teflon layerIn our initial photon migration study it has been shown that the characteristic Raman band of Teflon at 733 cm-1 is observable through 3 mm of overlaying horse metacarpal bone material.6 Figure 2A demonstrates that, under the conditions chosen in the present study, the same Teflon band can be recognized by visual inspection through 4.1 mm of horse bone. At that depth, SORS spectra recorded at spatial offsets up to 5 mm suffer from low signal to noise ratio: mainly the 4.1 mm thick bone layer above the Teflon is probed. However, using large spatial offsets, e.g. 7.5 mm, enables an overlap of the probed volume with the sub-surface Teflon layer and thus allows for identification of specific spectral markers with good signal to noise ratio. The results confirm our previous findings that larger SORS offsets probe predominantly deeper layers within the specimen whereas smaller offsets favor interrogating areas nearer the surface. In comparison to the horse metacarpal the whale bulla showed a much more intense fluorescence interference potentially obscuring small Raman signals. Nevertheless, for whale bulla bone an identification of the Teflon marker band at 733 cm-1 is possible for spectra recorded at large spatial offsets and with the Teflon layer located 4.1 mm below the surface of the bone material (see Figure 2B). All spectra displayed in Figure 2 have had their signal background removed by subtraction of a 6th order polynomial from each spectrum.12 Figure 2.Background-corrected Raman spectra of horse metacarpal end-shaft (metaphysis) (A) and whale bulla (B) with a Teflon layer located below 4.1 mm of bone material shown for selected SORS offsets, a) 0 mm, b) 2.5 mm, c) 5 mm, d) 7.5 mm, spectra are shifted vertically for clarity, dashed rectangles indicate the main Teflon Raman band at 733 cm-1.  The Teflon to bone intensity ratios have been calculated as a function of the applied SORS offset. Figure 3 displays the ratios for the largest investigated depth, i.e. with the Teflon layer located below 4.1 mm of bone material. For horse metacarpal the Teflon to bone ratio is 0.7 % at zero spatial offset and increases up to 5.0 % at 8 mm offset. The whale bulla bone shows a similar trend, i.e. an increasing ratio with larger SORS offsets. However, here the Teflon to bone ratio at zero spatial offset is twice as high (1.4 %) as for the horse metacarpal bone and increases only up to a value of 4.5 % at 7 mm spatial offset. Additionally, the value seems to reach a plateau for offsets larger than about 6 mm. The observed monotonic increase in the Teflon to bone ratio with increasing spatial offset is in accordance with other reports13,14 and may suggest that a further increase in spatial offset would be beneficial. However, as the overall Raman signal intensity is decreasing for larger SORS offset there exists an optimal offset at which the signal to noise ratio of the bottom layer Raman signal reaches a maximum.14 As noise was not a dominant feature in our study only Teflon to bone ratios are taken into account here. 3.2Depth dependence of Teflon signal recoveryFigure 4.Teflon to bone intensity ratios in dependence on the bone layer thickness above the Teflon slice using bone slices of horse metacarpal end-shaft (metaphysis) and whale bulla.  Figure 4 displays how the Teflon to bone intensity ratios vary with increasing the overlaying bone layer thickness above the Teflon slice for selected SORS offsets. The results confirm our previous findings investigating horse bone6 and how the decrease in Teflon to bone ratio with increasing depth of the Teflon slice is much more pronounced for small spatial offsets compared to large offsets. For horse metacarpal the maximum Teflon to bone ratio at the zero spatial offset can be obtained when the Teflon slice is placed on top of the bone material. In that case, the ratio is 1.11, i.e. the intensity of the Teflon band at 733 cm-1 is 11 % higher than that of the bone phosphate band at 961 cm-1. When increasing the depth of the Teflon slice to 4.1 mm inside the bone material the Teflon to bone ratio experiences an overall reduction of 99 %. This is due to the fact that small spatial offsets predominantly interrogate sample volumes close to the surface leading to a large overlap of the probed volume and the volume of the Teflon slice on condition the Teflon is located at or close to the surface. Keeping the SORS offset fixed (e.g. at 0 mm) and increasing the depth of the Teflon slice within the bone will lead to a significant reduction in the spatial overlap and consequently also in the Teflon to bone ratio. The application of larger SORS offsets (e.g. 7.5 mm) favors the interrogation of larger depth inside the sample material. This results in smaller Teflon to bone ratios when the Teflon slice is located at or close to the surface. In contrast, the spatial overlap between the probed volume and the Teflon slice will increase when placing the Teflon at greater depths resulting in increased Teflon to bone ratios. The absolute values are however larger for small depths as the described effect is accompanied by an overall signal decrease with increasing depth of the Teflon slice. At a spatial offset of 7.5 mm the maximum Teflon to bone ratio is observed at a Teflon depth of 0.6 mm. A depth increase from that value up to 4.1 mm leads to an overall reduction in the Teflon to bone ratio of 82 %. The whale bulla bone shows a similar behavior but with clearly reduced Teflon to bone ratios for depths of the Teflon slice up to about 1.2 mm that can be attributed to the different material properties. At the zero spatial offset the Teflon to bone ratio is 0.5 with the Teflon slice placed on top of the bone material. Increasing the Teflon depth to 4.1 mm this ratio is reduced by 97 %. At a spatial offset of 7.5 mm the maximum Teflon to bone ratio is observed at a Teflon depth of 1.0 mm. A depth increase from that value up to 4.1 mm leads to an overall reduction in the Teflon to bone ratio of 73 %. The data permitted the estimation of the optimal SORS offset required to achieve the maximum Teflon to bone intensity ratio for a given depth of the Teflon slice within the bone material. The corresponding curves are presented in figure 5 and correlate the approximate sampling depth from which the major signal is detected for a selected spatial offset. As expected, for horse metacarpal (and whale bulla) the maximum Teflon to bone ratio is reached at the zero spatial offset on condition that the Teflon slice is put on top of the bone material. With increasing depth both curves show a monotonic increase in the SORS offset needed for obtaining the maximum signal contribution from the Teflon slice. At a spatial offset of approximately 4.5 mm depths of 1.2 mm and 1.0 mm can be probed predominantly for horse metacarpal and whale bulla, respectively. For both types of bone the depth of major signal contribution increases to 2-3 mm when applying SORS offsets in the range of 7-8 mm. To effectively probe the bone material at the largest investigated depth of 4.1 mm would require spatial offsets of 9.5 mm and 8.7 mm for horse metacarpal and whale bulla, respectively. 3.3Determination of maximum accessible penetration depthFor biomedical investigations it is of particular interest to identify up to what depth the spectral signature of a material can be recovered for a given SORS offset. As can be seen from Figures 2 and 3 the main Teflon band at 733 cm-1 can be identified by visual inspection at Teflon to bone intensity ratios equal to 5 %. This value was therefore chosen as the threshold value to estimate the highest penetration depths probed for a given SORS offset. Figure 6 presents the data obtained from exponential fitting of the Teflon to bone ratios as a function of the bone layer thickness above the Teflon slice. In the chosen illumination and collection geometry even at the zero spatial offset depths of 1.4 mm and 2.3 mm could be interrogated for whale bulla and horse metacarpal, respectively. These relatively large sampling volumes are very beneficial for investigations of biological specimens as they help reducing naturally occurring inhomogeneity. Accessible depths show a monotonic increase with increasing SORS offsets but a plateau is reached for SORS offsets larger than 7 mm in the case of whale bulla. Using spatial offsets in the range between 7-8 mm, the maximum accessible penetration depths for the identification of chemically distinct species with Raman signatures different from those of normal bone are 4.0 mm and 3.8 mm for horse metacarpal and whale bulla, respectively. 3.4Correlation of penetration depths with bone mechanical and optical propertiesThe achieved penetration depths can be correlated with the mineral to collagen ratio (and thus to the bone material’s mechanical properties) and the optical characteristics (light transport length). Figure 7 shows background-corrected Raman spectra of pure horse metacarpal and whale bulla, i.e. without the Teflon slice being included inside the bone material, recorded at the zero spatial offset. The spectra are normalized to the bone phosphate band at 961 cm-1. In accordance with a previous study9 the data clearly show pronounced differences between the two types of bone with respect to the intensity of collagen signals, e.g. the amide III band around 1250 cm-1 and the CH2 deformation vibration at 1450 cm-1. From the spectral data the mineralization ratios, determined as the intensity of the bone phosphate band divided by the collagen CH2 deformation band, have been calculated and are given in Table 1. The mineralization ratio is more than five times larger for the whale bulla compared to the horse metacarpal. While the metacarpal as a long bone has a load-bearing function requiring the material to be tough (resistant to fracture), the primary function of the bulla is sound conduction which benefits from a highly mineralized and stiff structure. Figure 7.Background-corrected Raman spectra of horse metacarpal end-shaft (metaphysis) and whale bulla, normalized to the bone phosphate stretching vibration at 961 cm-1. Collagen bands show significant differences in intensity.  Light transport lengths were calculated from the transmission measurements according to Equation 1 and are given in Table 1. The average transport length for the highly mineralized bulla is higher by a factor of 1.7 in comparison to the metacarpal bone. Initially, this result may be counter-intuitive as one would expect a larger number of scattering events per given path length for denser, more mineralized bone material. Despite some deviation in absolute values our results are however in accordance with literature data. Based on absorption and scattering coefficients given in the literature transport lengths have been calculated and are given in Table 2. The values for cortical long bone vary from 492 μm to 529 μm and are lower than those values determined for more mineralized and harder skull bone in the range between 534 μm and 625 μm. A potential explanation for this effect may be that the light travels through the crystalline mineral and scatters from the protein (collagen) molecules. Table 1.Determined mineralization ratios and estimated light transport lengths of horse metacarpal end-shaft (metaphysis) and whale bulla, values are given as mean ± SD.
Table 2.Light transport lengths determined from absorption and scattering coefficients given in the literature.
On the one hand, we obtained smaller penetration depths for the more mineralized whale bulla bone for essentially all investigated spatial offsets. On the other hand, the bone material with the smaller light transport length, i.e. horse metacarpal bone, exhibited larger penetration depths. As shown in Figure 6 the difference between both types of bone however becomes less pronounced with larger SORS offsets, i.e. greater interrogated depths inside the bone tissue. 4.CONCLUSIONSORS investigations on two selected types of bone, with different mineralization levels and material properties, have been performed to assess photon migration characteristics. Using a 0.38 mm thick Teflon slice as a marker the approximate location of the interrogated volume inside the bone tissue has been determined. This is valuable information as it indicates the depth from which Raman signals are predominantly detected for a given SORS offset enabling depth-resolved studies. The maximum accessible penetration depth down to which a characteristic spectral signature originating from a substance chemically different from and not present in the native bone spectrum could be recovered has been estimated as well. With the Teflon slice as an example, its specific main Raman band could be retrieved through 4.0 mm and 3.8 mm of overlaying compact bone tissue for horse metacarpal and whale bulla, respectively. The more mineralized bulla exhibited a smaller penetration depth but a larger light transport length compared to the metacarpal bone. The findings of this study increase our understanding of SORS analysis of bone and thus have impact for medical diagnostic applications e.g. enabling the non-invasive detection of spectral changes caused by degeneration, infection or cancer deep inside the bone matrix. ACKNOWLEDGEMENTSThe authors wish to thank the Engineering and Physical Sciences Research Council (EP/H002693/1), the Science and Technology Facilities Council, and University College London for their support. We thank John Currey for providing the whale bone samples. REFERENCESKerns, J. G., Gikas, P. D., Buckley, K., Shepperd, A., Birch, H. L., McCarthy, I., Miles, J., Briggs, T. W. R., Keen, R., Parker, A. W., Matousek, P. and Goodship, A. E.,,
“Evidence from Raman Spectroscopy of a Putative Link Between Inherent Bone Matrix Chemistry and Degenerative Joint Disease,”
Arthritis Rheumatol, 66
(5), 1237
–1246
(2014). https://doi.org/10.1002/art.v66.5 Google Scholar
Buckley, K., Kerns, J. G., Gikas, P. D., Birch, H. L., Vinton, J., Keen, R., Parker, A. W., Matousek, P. and Goodship, A. E.,,
“Measurement of abnormal bone composition in vivo using noninvasive Raman spectroscopy,”
IBMS BoneKEy 11, Article number, 602
(2014). Google Scholar
Okagbare, P. I., Begun, D., Tecklenburg, M., Awonusi, A., Goldstein, S. A. and Morris, M. D.,,
“Noninvasive Raman spectroscopy of rat tibiae: approach to in vivo assessment of bone quality,”
J. Biomed. Opt, 17
(9), 090502-1
–090502-3
(2012). https://doi.org/10.1117/1.JBO.17.9.090502 Google Scholar
Matousek, P. and Stone, N.,,
“Recent advances in the development of Raman spectroscopy for deep non-invasive medical diagnosis,”
J. Biophotonics, 6
(1), 7
–19
(2013). https://doi.org/10.1002/jbio.201200141 Google Scholar
Buckley, K., Kerns, J. G., Vinton, J., Gikas, P. D., Smith, C., Parker, A. W., Matousek, P. and Goodship, A. E.,,
“Towards the in vivo prediction of fragility fractures with Raman spectroscopy,”
J. Raman Spectrosc, 46
(7), 610
–618
(2015). https://doi.org/10.1002/jrs.4706 Google Scholar
Sowoidnich, K., Churchwell, J. H., Buckley, K., Kerns, J. G., Goodship, A. E., Parker, A. W. and Matousek, P.,,
“Spatially Offset Raman Spectroscopy for photon migration investigations in long bone,”
in Proc.SPIE-OSA,
954009-1954009-7
(2015). Google Scholar
Sowoidnich, K., Churchwell, J. H., Buckley, K., Goodship, A. E., Parker, A. W. and Matousek, P.,,
“Photon Migration of Raman Signal in Bone as measured with Spatially Offset Raman Spectroscopy,”
J. Raman Spectrosc, 47
(2), 240
–247
(2016). https://doi.org/10.1002/jrs.v47.2 Google Scholar
Matousek, P.,,
“Inverse Spatially Offset Raman Spectroscopy for Deep Noninvasive Probing of Turbid Media,”
Appl. Spectrosc, 60
(11), 1341
–1347
(2006). https://doi.org/10.1366/000370206778999102 Google Scholar
Buckley, K., Matousek, P., Parker, A. W. and Goodship, A. E.,,
“Raman spectroscopy reveals differences in collagen secondary structure which relate to the levels of mineralisation in bones that have evolved for different functions,”
J. Raman Spectrosc, 43
(9), 1237
–1243
(2012). https://doi.org/10.1002/jrs.4038 Google Scholar
Buckley, K., Kerns, J. G., Parker, A. W., Goodship, A. E. and Matousek, P.,,
“Decomposition of in vivo spatially offset Raman spectroscopy data using multivariate analysis techniques,”
J. Raman Spectrosc, 45
(2), 188
–192
(2014). https://doi.org/10.1002/jrs.v45.2 Google Scholar
Das, B. B. and Alfano, R. R.,,
“Ultrafast time-gated approach in optical biomedical imaging,”
Curr. Sci, 77
(7), 885
–893
(1999). Google Scholar
Lieber, C. A. and Mahadevan-Jansen, A.,,
“Automated Method for Subtraction of Fluorescence from Biological Raman Spectra,”
Appl. Spectrosc, 57
(11), 1363
–1367
(2003). https://doi.org/10.1366/000370203322554518 Google Scholar
Matousek, P., Morris, M. D., Everall, N., Clark, I. P., Towrie, M., Draper, E., Goodship, A. and Parker, A. W.,,
“Numerical Simulations of Subsurface Probing in Diffusely Scattering Media Using Spatially Offset Raman Spectroscopy,”
Appl. Spectrosc, 59
(12), 1485
–1492
(2005). https://doi.org/10.1366/000370205775142548 Google Scholar
Maher, J. R. and Berger, A. J.,,
“Determination of Ideal Offset for Spatially Offset Raman Spectroscopy,”
Appl. Spectrosc, 64
(1), 61
–65
(2010). https://doi.org/10.1366/000370210790571936 Google Scholar
Ugryumova, N., Matcher, S. J. and Attenburrow, D. P,,
“Measurement of bone mineral density via light scattering,”
Phys. Med. Biol, 49
(3), 469
–483
(2004). https://doi.org/10.1088/0031-9155/49/3/009 Google Scholar
Margallo-Balbás, E., French, P. J. and Wieringa, P. A.,,
“Light Transport in Trabecular Bone: Monte Carlo Simulation Based on 3D Triangle Meshes,”
in Proc. SPIE,
61421K-1
–61421K-12
(2006). Google Scholar
Firbank, M., Hiraoka, M., Essenpreis, M. and Delpy, D. T.,,
“Measurement of the optical properties of the skull in the wavelength range 650-950 nm,”
Phys. Med. Biol, 38
(4), 503
–510
(1993). https://doi.org/10.1088/0031-9155/38/4/002 Google Scholar
Bashkatov, A. N., Genina, E. A., Kochubey, V. I. and Tuchin, V. V.,,
“Optical properties of human cranial bone in the spectral range from 800 to 2000 nm,”
in Proc. SPIE,
616310616310
–111
(2006). Google Scholar
Genina, E. A., Bashkatov, A. N. and Tuchin, V. V.,,
“Optical Clearing of Cranial Bone,”
Advances in Optical Technologies,
(20082008). https://doi.org/10.1155/2008/267867 Google Scholar
|