|
|
1.INTRODUCTIONGlass as a process tool, container or a piece of art has a unique history. First findings are in Mesopotamia and Egypt dated to around 1600 BC. Its hot processing capability offers a wide range of applications. Ingredients like sodium oxide (Na2O), lime (CaO), magnesia (MgO), alumina (Al2O3) enables a processing/melting temperature of around 600°C (example a soda-lime glass). The principal constituent is silica, SiO2, which in soda-lime glass comprises about 60% of the glass, but the higher the silica content of the glass, the more difficult and demanding it is to produce. Pure quartz glass (SiO2) with an impurity content in the ppm range (10-6) has a softening temperature of 1730°C. During the irreversible melting process of a crystalline precursor, the long-range ordered crystalline structure merges into an amorphous structure of glassy silica (see figure 1). Figure 1.The amorphous structure of glassy silica (SiO2) in two dimensions (left). No long-range order, which is characteristic for crystalline SiO2, is present (right), although there is local ordering with respect to the tetrahedral arrangement of oxygen (O) atoms around the silicon (Si) atoms. [1]  The optical, thermal and mechanical properties of fused quartz (natural quartz glass) or fused silica (synthetic quartz glass) are superior to those of other types of glass due to its purity and opens up new fields of applications. At the peak of the industrialization in 1890, the Heraeus brothers Heinrich and Wilhelm invited their former school friend Dr. Richard Küch (1860-1915) as research associate to join their growing technology company in Hanau, Germany. In 1899 Küch succeeded in producing high-purity, bubble-free quartz glass. His process to melt rock crystal in the oxyhydrogen flame led to the foundation of Heraeus Quarzschmelze. 2.FIRST COMMERCIAL PRODUCTIn 1904 after 5 years developing and optimizing the quartz glass melting process, the mercury vapor quartz glass lamp was finished, and became the market leader under the name “Artificial sunlamp - Original Hanau®”. The Hanauer-Quarzlampen-Gesellschaft established an institute in which, with the most modern methods of the time, fought against Tuberculosis, Rickets, etc. The healing rays of the artificial sun lamp cured Tuberculosis in children from urban areas who could not travel to high altitude places to seek the UV radiation they needed (see figure 2). Figure 2.(left) Artificial (UV) sun light - here: Sunlamp Original Hanau. (right) Modern remedies against childhood mortality. The picture shows infants under the expert supervision of nurses during irradiation by artificial sunlight (1928). [2]  This development then led to the invention of the commercial mercury lamp in 1910. Melted rock crystal or later quartz sand in form of a lamp tube enabled higher temperature, higher luminosity, smaller geometry and more spectral lines in the UV. Being able to develop this kind of UV lamp poses a challenge – you must have the tools to measure the optical performance. 3.TRANSMISSIONThe performance of the glass used I a given application is mainly driven by the optical transmission. Being able to measure the transmission facilitates the optimization of the raw material used in fused quartz manufacture to increase the light transmission of the resulting glass (see figure 3). Transmission in general means: The optical value “transmission” represents an intensity comparison of light with and without disturbance due to optical material in its path. Today there are two standard types of transmission spectrometer for measuring wavelength-resolved optical transmission (for quartz glass): grating spectrometers for the UV and visible with a wavelength range of 120 –900 nm and FTIR spectrometers for IR spectrum with a wavelength range of 800 – 5000 nm. Accuracy for both measurements are in the range of ±0.2%. However, the surface condition of the measured sample, the geometry and the light source stability have a significant influence on the result. For optical bulk materials, there are two different descriptions for transmission: total transmission and internal transmission. Internal transmission describes the behavior without the Fresnel reflection losses of both entrance and exit optical surfaces (represented by the fine dotted curve in figure 3), whereas these losses are included in the total transmission. Figure 3.Total transmission of quartz glass from rock crystal and quartz sand (left) ultraviolet range (UV) and (right) infrared range (IR).  The reasons for different transmission behavior can be found in the chemical composition of the quartz glass or even a step before in the chemical composition of the raw material rock crystal or quartz sand. 4.CHEMICAL COMPOSITIONAccurate transmission measurements enable comparison and study of the UV performance of quartz glass grades produced using different sands and rock crystals. The influence of different impurities on the transmission can be seen in figure 4. High resolution trace element analysis in the ppb range (<10-9) supports the studies. Atomic absorption spectroscopy (AAS) focuses on trace element specific absorption lines, whereas optical emission spectroscopy (ICP-OES) analyses characteristic emission lines of the trace elements after excitation. The resolution of such analysis is typically 10 ppb. Typical metallic trace impurities can be found in table 1. Table 1.Typical metallic trace impurities of quartz glass from quartz sand.
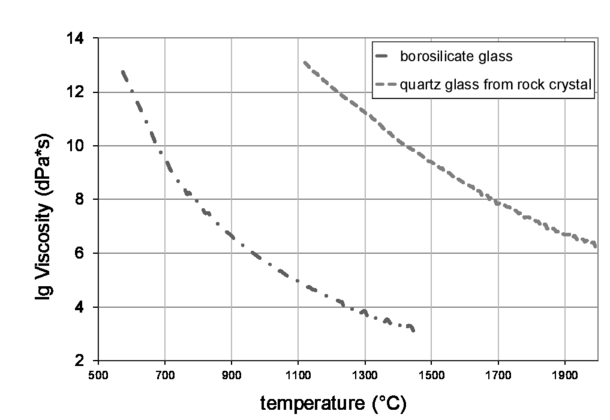
Cleaning procedures for the raw material before melting for example chlorination or floatation can reduce the level of impurities significantly. Today, historically mined rock crystals are not much used anymore. Synthetically grown quartz crystals show a much better transmission behavior due to minimized metallic impurities. 5.OPTICAL QUARTZ GLASSAround 1934 the optical market strived for better materials than quartz glass made from quartz crystals could offer. The crystals produced a material too variable in homogeneity, which limited the performance of optical imaging applications. The development of a light processing and light forming quartz glass challenged not just the optical homogeneity of refractive index that was possible, but also demanded the highest transmission from near UV to IR and that the material be colorless and free of inclusions, bubbles, striation and strain – in other words the standards we now have for todayʼs optics. The main driver for such a glass over the next 10 years was the requirement of first class optical devices in World War II. Measurement methods had to be developed to be able to qualify optical performance. 5.1Refractive index homogeneityThe refractive index of optical quartz glass can feature localized, steep changes. The shadow method brings this out in a pictorial manner. Steep changes can be magnified with a point light source and a spaced-apart screen, as illustrated in figure 5. Figure 5.(left) Principle setup of the shadow method. (right) Shadow print of natural fused silica as grown and after homogenization. [3]  The shadow print for a standard fused quartz glass (“as fused”) clearly shows glass particles sticking to each other instead of a homogeneous glass material. Heraeus Quarzglas invented a unique process of material homogenization that washes out the steep refractive index gradients resulting in a very homogeneous shadow pattern (“homogenized”), see figure 5 right. However, optical applications are constantly aiming for higher performance and more sensitive measurements. To increase the resolution of homogeneity measurements, interferometry as testing method of the refractive index distribution was introduced. Interference patterns of a reference wavefront and a wavefront passing through optical material reveal refractive index modulations in the material over a wide inspection area. Typically, todayʼs laser interferometers are using an inspection wavelength of 632.8 nm. This measurement enables a typical accuracy (2σ) of 0.3 ppm absolute although temperature and vibration stability has to be considered when defining measurement accuracy. One has to differentiate between 2 possible interferometric measurements: surface quality (measurement of the front surface in reflection) or transmitted wavefront error. The latter can be calculated back to a refractive index variation of the bulk material when the surface contribution is known. Optical material manufacturers are interested in the second measurement; manufacturer of polished optical components are additionally interested in the surface quality. Due to the fact that the melting process of quartz glass builds the material layer by layer, striation in the material might occur. Striation are represented by layers or filaments of different refractive index compared to the surrounding material, see figure 6 top. Figure 6.Interferometric images of natural fused silica as grown (top) and after homogenization (bottom). [3]  Homogenization steps during quartz glass processing enables the removal of striae in the material and the interferometric measurement shows a homogeneous interference pattern as a result. The study of high frequency variations in the refractive index require a mathematical description of the refractive index. The interference pattern of the measurement or wavefront deviations can be transformed in a 2-D map of the refractive index change Δn (PV value: maximum peak to valley difference). In optics, Zernike polynomials (see figure 7) are used to represent wavefronts, which, in turn, describe the imaging errors of optical systems. Figure 7.(left) The first 21 Zernike polynomials, ordered vertically by radial degree and horizontally by azimuthal degree. [4] (right) Refractive index homogeneity of a circularly formed fused silica blank less the offset Z0 and tip/tilt Z1 instrument calibration and after removal of the power term Z20.  Zernike term Z0 and Z1 are the typical calibration terms for the interferometer. Z0 represents the offset (“piston”) - the calibration of the system – and Z1 represents the tip/tilt effect, if the surface of the inspected part is not parallel to the incoming wavefront. The quartz glass production process at Heraeus is characteristically radially symmetric (see figure 7 right). The majority of the refractive index change is due to the Zernike term Z20 also called “defocusʼ. This term can be easily polished out by an optical finisher. By subtracting the Zernike defocus term, optical quartz glass with very good homogeneities can be achieved. Sensitive appliations are interested in the small scale variations or high frequency errors. By substracting even more Zernike term, the small scale variations can be made visible and analysed. 5.2BirefringenceOptical materials can vary in the refractive index distribution, but also in their polarization behavior. Birefringence is the optical property of a material having a refractive index that depends on the polarization and propagation direction of light. Natural pre-existing or mechanically introduced stress in quartz glass can lead to polarization rotation of the penetrating light, which can be made visible under crossed polarizers, see figure 8. Figure 8.(left) Principle of birefringence measurement. The first polarizer generates linearly polarized light. If the sample under test does not change the polarization plane, the light is extinguished be the second polarizer. (right) Stress birefringence of a circularly formed fused silica lens blank.  Using crossed polarizers and a calibrated gray wedge leads to a measurement accuracy of about 5 nm, whereas a polarized laser scanning setup using a wavelength of 632.8 nm provides a higher resolution of up to 0.01 nm and provides a 2-D map of stress induced birefringence (SIB) values. A well-known process for subsequent improvement of optical homogeneity and stress induced birefringence is high temperature annealing. Stress introduced during manufacturing can be easily relaxed with an appropriate annealing cycle. 6.MECHANICAL AND THERMAL RESISTIVITYFollowing the commercialization of the mercury lamp, arguably the next significant challenge for quartz glass lamp tubing was the development of the first laser systems around 1960. Flash lamps were used to pump the active laser medium and had to withstand high power densities and thermal shocks (figure 9). Mechanical and thermal material properties, such as viscosity, thermal expansion, material bending and strength, needed to be measured. The working temperature of glass depends on its chemical composition and therefore so does the viscosity (see figure 10 and table 2). In general more impurities lead to a lower thermal stability, however, for quartz glass materials, the working temperature is influenced by the aluminum and OH content in the material. Therefore the working temperature of natural quartz glass is higher than for synthetic fused silica.. Table 2.Characteristic temperatures in °C.
Temperature gradients in optical materials lead to thermal expansion. This means for applications like laser or telescope mirrors, the wavefront will be distorted. The coefficient of thermal expansion (CTE) can be measured in two ways: mechanically via volume change or interferometrically via wavefront distortion. Table 3 shows CTE values α in 10-6/K at 20 °C. Table 3.Coefficient of thermal expansion values for different optical materials in in 10-6/K at 20 °C.
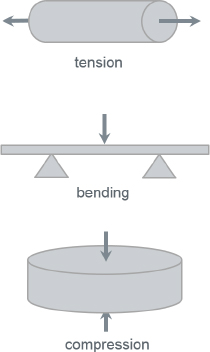
Volume change due to thermal expansion automatically questions the resistance to fracture. For mechanical strengths like tension, bending or compression standard measurement methods have been developed referring to well defined laboratory conditions, sample geometries and surface finishes. However, the listed values in table 4 corresponds to the standard measurement techniques and this might be different to the real implementation of the glass in an optical system. Conditions like temperature, moisture, pressure, mounting, stress can vary and negatively influence the listed strength values. Table 4.Typical mechanical properties of fused silica. [6]
The measurement of mechanical properties is equal to finding a statistical probability of failure. Tests are continuously repeated under the same condition to be able to evaluate the distribution and its variances (Weibull statistics). 7.UV SYNTHETIC FUSED SILICAAround 1955 the lamp industry strived for a lower UV band gap than natural quartz glass offers (see figure 11). In the process of flame hydrolysis (direct quartz process), a synthetic silicon tetrachloride (SiCl4) gas is decomposed by an oxyhydrogen flame to build up high purity fused silica. Metallic impurities could be reduced to a value less 0.1 ppm (natural quartz glass has impurity values of around 30ppm). The excimer laser development after 1970 further supported the evolution of synthetic fused silica, because the laser wavelength approached values below 200 nm, where optical materials with highest transmission were required. To understand the behavior of fused silica, optical properties such as luminescence, defect center generation and damage threshold became of more and more importance. Metallic impurities in quartz glass cause luminescence – absorption of light in the UV range and re-emission at a longer wavelength (see figure 12). The transmission loss is unwanted for the UV applications, and the re-emitted light distorts spectroscopy results. The detection of low a concentration of defect centers, which cannot be seen by trace impurity analysis or transmission measurement, is done by fluorescence spectroscopy (see figure 13). Emission can be stimulated mainly by UV excitation. UV radiation is capable of generating defect centers in fused silica (equation (2)). Broken bonds in the material structure lead to absorption bands [8]: The NBOH defect (non-bridging-oxygen hole centers) Si-O* lead to an absorption at 265nm, E’ centers Si* at 215 nm and ODC (Oxygen deficiency centers) defect Si-Si at 248nm (Ge-ODC is slightly shifted). Influence of defect centers on the performance of optics is measured via direct transmission loss during/after irradiation or absorption band spectroscopy. Long term tests can last from weeks to years. With the process of actively loading fused silica with hydrogen, the free hydrogen content in the material exceeds a value of 1017 molecules/cm3. The free hydrogen saturates the absorbing defects (see equation (3) and (4)) and increases the transmission in the UV. 8.IR SYNTHETIC FUSED SILICADriven by spectroscopy in the near IR range, a low absorption material for infrared wavelengths was developed. In 1958 Suprasil W was introduced, a water free synthetic fused silica. The oxyhydrogen flame fusion process automatically introduces OH into the material during production. By changing the flame gas partially to carbon monoxide, an improvement could be made. In 1964 arc melting instead of gas burner production was tested and in 1980 the soot deposition with subsequent chemical drying and vitrification optimized fused silica materials for the IR range with an OH content of less than 1 ppm (see figure 14). Figure 14.Infrared transmission of fused silica with different SiOH content (min. OH content here 10ppm).  Measurement capabilities for OH content in fused silica are Raman or FTIR spectrometers with a resolution in the sub-ppm range. However, it is required to have a sufficient path length otherwise measurements are too inaccurate. Pure absorption in the UV and IR is difficult to identify. Due to the 1/λ4 dependency of the volume scattering in the UV, the absorption measurement as a direct method has been developed. Absorption in fused silica leads to a temperature increase and therefore a refractive index change. Due to this thermal lensing effect, a propagating wavefront will be distorted. This distortion can be measured with a Hartmann-Shack-Sensor and calculated back to an absorption value (figure 14 and 15) [9]. Absorption measurement in the IR via the well-known technique of photo-thermal common path interferometry and a table of absorption coefficients are described in [8, 10, 11]. Figure 15.Measurement of absorption by detecting the wavefront distortion due to thermal lensing by Hartmann-Shack-Sensor. [9]  The reduction of absorption in the infrared was mostly been driven by the telecom fiber business. Fused silica fibers need low OH material to be able to have a minimized attenuation over a long travel distance. Attenuation measurements for different fiber materials are shown in figure 17. Modern fiber systems are working in the range of 850 – 1625 nm and the lowest attenuation can be found at ~1310 nm and ~1550 nm. The background limit <1300 nm is given by volume scattering and at >1700 nm by network absorption. Figure 17.Typical specialty fiber attenuation spectra depending on different silica core materials mainly divided into two groups namely preforms with high hydroxyl (OH) content in the core material such as SSU, SBU, SXU and SOU and preforms with a low OH content such as SWU, STU and STU-D preforms. [8]  9.LASER DAMAGE OF FUSED SILICAFor more than 50 years, laser damage of optics has been a heavily discussed topic. Laser energy fluences and intensities increase from year to year and the damage thresholds of coatings, surfaces and bulk material are continually challenged. There are numerous influencing elements such as: wavelength (longer = higher damage threshold), CW or pulsed (longer = better), bubbles and inclusions, surface conditions as polished or with a coating, molecular contamination, mounting stress and temperature. There are a wide variety of techniques in the market to quantify laser damage from theoretical calculations [12] to surface [13] or bulk measurements [14]. As a bulk material manufacturer, our aim is to reduce all possible defects in the material to maximize the damage threshold of the bulk fused silica. Bubbles and inclusions in transmissive optical elements produce to intensity modulations in the material resulting in higher intensities than expected, create defects (“plasma bubbles”) and can subsequently destroy the back surface of an optic. This effect can propagate through a laser system and damaging every single optic, see figure 18. Figure 18.(left) Influence of a bubble/inclusion on the wavefront distortion in optical material. (right) bulk and rear surface damage due to an inclusion in the optical material.  DIN 58927 defines bubble and inclusion classes for optical materials. However, bubble class 0 means: no bubbles <80μm diameter are considered. For high power high energy laser systems, this specification is not acceptable anymore. Replacement of optics has significant cost implications for laser projects. Todayʼs specification is a material with no bubbles or inclusions >10μm with the aim of having no defects at all. Heraeus Quarzglas produces synthetic fused silica that meets this ambitious bubble and inclusion specification and is able to measure bubbles and inclusions in large size optics with a resolution of 5μm. REFERENCESBernstein, R. and Carpi, A.,
“Properties of Solids,”
Visionlearning, CHE-3
(2),
(2015). Google Scholar
Bundesarchiv,
“Bild 102-07072 / CC-BY-SA 3.0, CC BY-SA 3.0 de,”
https://commons.wikimedia.org/w/index.php?curid=5414110 Google Scholar
Rau, K, 60 Jahre Quarzglas, 25 Jahre Hochvakuumtechnik, 77
–104 W.C. Heraeus GmbH, Hanau
(1961). Google Scholar
Zom-B at en.wikipedia,
“CC BY 3.0,”
(2016) https://commons.wikimedia.org/w/index.php?curid=15880824 Google Scholar
Immega, G,
“Own work, CC0,”
(2016) https://commons.wikimedia.org/w/index.php?curid=10397843 Google Scholar
Heraeus Quarzglas,
“Data & Properties brochure,”
(2016) https://www.heraeus.com/media/media/hqs/doc hqs/products and solutions 8/optics/Data and Properties Optics fused silica EN.pdf Google Scholar
Mohn, H., 60 Jahre Quarzglas, 25 Jahre Hochvakuumtechnik, 77
–104 W.C. Heraeus GmbH, Hanau
(1961). Google Scholar
Nürnberg, F., Kühn, B.,
“Bulk damage and absorption in fused silica due to high-power laser applications,”
in Proc. SPIE,
(2015). Google Scholar
Kühn, B.,
“Minimizing Losses in Synthetic Fused Silica for Immersion Lithography,”
in 4th International Symposium on Immersion Lithography,
(2007). Google Scholar
Stubenvoll, M.,
“Measurement and compensation of laser-induced wavefront deformations and focal shifts in near IR optics,”
Opt Express, 22
(21), 25385
–25396
(2014). https://doi.org/10.1364/OE.22.025385 Google Scholar
Stubenvoll, M.,
“Photothermal method for absorption measurements in anisotropic crystals,”
Rev. Sci. Instrum., 87
(023904),
(2016). Google Scholar
, “Semrock, IDEX,”
(2016) https://www. semrock. com/ldt-calculator. aspx Google Scholar
, “LIDARIS, LIDT measurements,”
(2016) http://lidaris.com/laser-damage-testing/ Google Scholar
Jedamzik, R.,
“Recent results on bulk laser damage threshold of optical glasses,”
in Proc. SPIE,
(2013). Google Scholar
|