|
|
IntroductionAn important field of application of lasers is biomedical optics. Here, they offer great utility for diagnosis, therapy and surgery. For the development of novel methods of laser-based biomedical diagnostics careful study of light propagation in biological tissues is necessary to enhance our understanding of the optical measurements undertaken, increase research and development capacity and the diagnostic reliability of optical technologies. Ultimately, fulfilling these requirements will increase uptake in clinical applications of laser based diagnostics and therapeutics. To address these challenges informative biomarkers relevant to the biological and physiological function or disease state of the organism must be selected. These indicators are the results of the analysis of tissues and cells, such as blood. For non-invasive diagnostics peripheral blood, cells and tissue can potentially provide comprehensive information on the condition of the human organism. A detailed study of the light scattering and absorption characteristics can quickly detect physiological and morphological changes in the cells due to thermal, chemical, antibiotic treatments, etc [1-5]. The selection of a laser source to study the structure of biological particles also benefits from the fact that gross pathological changes are not induced and diagnostics make effective use of the monochromatic directional coherence properties of laser radiation. Laser diagnostics methods are based on a simple obvious fact that the combined optical properties of biological soft tissues always are a function of physiological, functional and pathological state (condition) of the tissues and organs. Most of the spectral optical properties of human tissues and liquids, especially of the blood, are different between normal and pathological cases. Therefore, it is possible to determine the tissues’ and organs’ clinical state by means of measuring in vivo (in situ) its spectral optical properties - absorbance, scattering, reflectance, fluorescence. Strictly speaking, there are the same basic physical principles in non-invasive optical diagnostics that are used in a conventional laboratory spectroscopy in conventional clinical tests, but these the advantages that non-invasive diagnostics are of in vivo and real-time operating mode [2,3,6,7]. This review summarizes the possibilities of a new multifunctional laser non-invasive diagnostic system (MLNDS) LAKK-M, developed for tissue research and diagnostics. Considering different levels of the tissue blood volume, the approach proposed here allows the calculation of important technical and metrological restrictions of the instruments, such as the sensitivity ranges and power related signal-to-noise ratios for different spectral channels and biomedical parameters. In this paper we presented a joint research to develop the new underlying laser technologies that form an advanced non- or minimally invasive bio-photonic system for diagnostics and phototherapy. For years, photonics based techniques have been employed all over the world to screen, diagnose and treat many medical conditions. Their role has been particularly vital for research into various forms of cancer. In recent years, many attempts have been made to rectify this, with various groups developing PS which absorb at higher wavelengths of light or engage in 2 photon absorption [8,9]. Recently, some groups have begun to revisit pioneering work done in the 1970s demonstrating direct singlet oxygen generation through spin transitions induced by irradiation with 1268nm light. Generation of singlet oxygen by direct irradiation with 1268nm light has been termed the “light-oxygen effect” (LOE) [10] and has been suggested as a therapeutic tool for cancer control, similar to PDT but without the need for PS owing to the aberrant metabolism of cancer cells and their suggested impaired ability to deal with ROS. The therapeutic worth of LOE against cancer has previously been demonstrated in cell lines by Anquez [11]. Thus, the review also reviews report of the singlet molecular oxygen state generated by direct excitation. We have designed in vitro experiments to determine the ability of 1268 nm laser irradiation to induce singlet oxygen generation and death pathways in HeLa cells [20]. Section 1 offers an introduction to the basics of multi-parametric analysis and complex diagnostic parameters of MLNDS. Section 2 considers LDF- and TRO-graphs to investigate tissue respiration during the synchronization of microvascular blood flow and oxygen saturation rhythms under normal conditions and during adaptive changes. Section 3 discusses the data on the variability of the measurement results of biological tissue in fluorescent spectroscopy. Section 4 describes a novel optical technique for the non-invasive assessment of cardiovascular disease endogenous fluorophores (biomarkers) in an in vivo mouse model relevant to oxidative stress. Section 5 summarizes the absorption and scattering parameters of bladder tissue and presents fluorescence spectroscopy over a range of wavelengths to determine tissue quantum fluorescence yields for distinct fluorophores such as NADH and collagen. Section 6 presents our experiments of generating singlet oxygen by direct 1268 nm excitation. 1.LAKK-M MLNDSToday the non-invasive in vivo and real-time methods of diagnostics are desirable for the integration in complex. It will allow work with the same tissue volume by any set of channels at one time. Multi-parametric analysis and complex diagnostic parameters of MLNDS, single devices integrating various optical diagnostics techniques, represent a promising and progressing area in biomedical spectrophotometry [13]. This allows medics and clinicians not only to receive the collective results of the biochemical and physiological parameters which would normally be collected by each individual technique but also, and more importantly, to perform multi-parameter patient examination to identify more subtle individual characteristics of blood flow and tissue metabolism based on the simultaneous use of different diagnostic techniques and comprehensive data analysis. This possibility is realized in the LAKK-M system which allows the following blood microcirculation parameters to be obtained: index of blood microcirculation (Im), tissue oxygen saturation (StO2), relative blood volume (Vb), arterial blood saturation (SaO2). Together with collection and analysis of fluorescence spectra of tissue endogenous biomarkers this device is a unique and comprehensive system for research and diagnostics in various fields of biomedicine (cardiovascular diseases, diabetes, cancer, cosmetic surgery, etc.). The development of the LAKK-M has followed. The device includes 4 narrow-band LED and semiconductor laser sources at the following wavelengths (Table 1). Table 1 –Laser used in LAKK-M by function
CW = continuous wave P = Average power in pulsed mode (*Figures will vary according to material) The system (Fig.1) is intended for simultaneous investigation of the characteristics of certain biological activities in a single sampled in-vivo tissue volume. An assessment of the condition of the subject tissue with respect to the following important markers of biological vitality is provided:
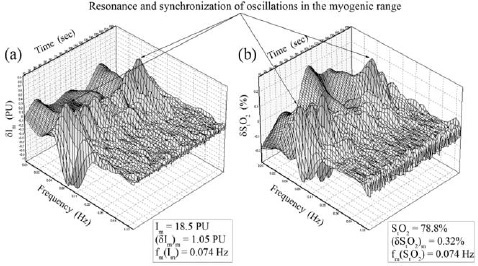
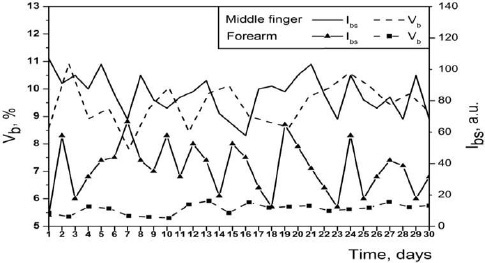
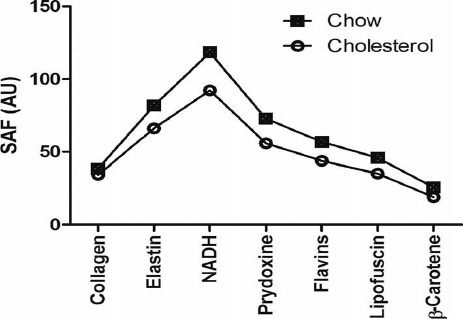
The device apparatus includes a fibre-optic system to allow analysis at selected points on the body. An illustration of the laser, detector and spectrophotometer set-up at the fibre-optic tip is shown in Figure 2. Fig. 2.Optical probe of LAKK-M device: Laser Doppler Flowmetry, Tissue Oximetry, Fluorescent Spectroscopy.  In non-invasive medical spectrophotometry (NMS) the most sensitive method known for recording the dynamic processes in the blood microcirculatory system is Laser Doppler Flowmetry (LDF). This is based on the measurement of Doppler frequency shifts, which occur after the backscattering of radiation from red blood cells moving at different speeds in small vessels – arterioles, capillaries and venules [3]. This is represented as a microcirculation index Im in arbitrary perfusion units. Perfusion fluctuations are recorded as a complex non-periodic process. The variable component provides valuable information on the modulation of blood flow. Spectral signal processing algorithms used for decoding and analysis provide information about the vascular tone in terms of contribution of the different regulatory mechanisms of endothelial, neurogenic, myogenic, breath, pulse micro-haemodynamics [2]. By following an integrated biotechnical approach, we can formulate discreet measurement tasks for the methods incorporated in the NMS and consider the general functional scheme of the measurements made in NMS (Fig.4.). In the diagnostic device, light with a wavelength λ and with a power Ps(λ) from the radiation source 1 is delivered by optical lighting system 2 to the examined biological object (BO) 3. Fig. 3. –Generalised functional scheme of optical measurement by NMS: 1 - radiation source, 2 - optical lighting scheme, 3 - biological object, 4 - irradiation transport system, 5 - photodetector, 6 - electronics, 7 computer.  Depending on the diagnostic method, the light source may be either a monochromatic (laser) or a set of variable light sources with different emission spectra. In tissue, radiation is extensively scattered at the boundaries of morphological irregularities and is partially absorbed by substances like water, melanin, haemoglobin, etc. before the re-emergence of the attenuated radiation. Due to multiple scattering events, part of the radiation exiting the BO forms a flux of backscattered light. This irradiation with power Pr(λ) < Ps(λ) is delivered to the device by the irradiation transporting system 4 to the recording unit of the diagnostic device. In a simplified case it is sent to the photodetector 5 that performs a linear transformation of the optical power Pr(λ) to the photocurrent Ic(λ). The produced electrical signal is processed in analogue mode (photocurrent Ic(λ) to voltage U(λ) conversion, amplification, filtering, etc.) in the electronics block 6, digitised and transmitted to the computer 7 for further computation. As a result, biomedical parameters such as Im, StO2 and Vb are calculated. Thus, changes in blood microcirculation can be registered by the diagnostic NMS following changes in the optical properties of biotissue. Tissue reflectance oximetry (TRO) is based on the principles of absorption spectroscopy and allows non-invasive (in vivo, transcutaneous) monitoring of micro-haemodynamics and oxygen transport and utilisation within the entire blood microcirculation system. TRO determines the relative volume of all fractions of haemoglobin (total haemoglobin) in a tissue volume, the average level of blood volume – Vb and oxygen saturation of the microvasculature, generally containing arterioles with oxyhaemoglobin and venules with deoxyhaemoglobin, the average level of tissue oxygen saturation – StO2 [13]. The changes in tissue oxygen saturation are therefore essentially the increases and decreases of tissue oxygen consumption. There have been a few studies of rhythms (for example, spectral processing algorithms) within these recorded TRO-signals [12,13], and literature reporting the relationships between perfusion, Im, and StO2-graphs are rare [12]. In isolated cases it has been used to assess vasomotion and myogenic rhythms for perfusion and tissue oxygen saturation, for example [13]. The Laser Fluorescent spectroscopy (LFS) provides effective and non-invasive optical diagnostic approach based on the autofluorescence of biomolecules containing endogenous fluorophores such as porphyrins and the coenzymes NADH, NADPH, and FAD (Fig.5). These fluoresce between 400-600nm and are indicators of metabolic function. Blue-green autofluorescence is therefore an appropriate measure of the function of metabolism and cell or tissue disruptions. Autofluorescence in the yellow/red spectral region is based mainly on endogenous porphyrins. This permits fluorescence based detection of a variety of skin diseases, including acne and squamous cell carcinoma. The sensitivity of non-invasive laser based autofluorescence diagnostics can be enhanced by time-gated fluorescence measurements using an appropriate time delay between ultra-short laser excitation and detection [15]. Fig. 5.Fluorescence spectra of endogenous fluorophores of epithelial tissue at 365 nm (1), 430 nm (2), 532 nm (3) and 635 nm (4).  LFS provides effective optical diagnostics, primarily in medical areas such as oncology, transplantation, cosmetology and surgery. LFS for medicine is a complicated technique that depends on the temperature, topological heterogeneity, different properties of each sample, etc. 2.Synchronisation of micro-vascular blood flow and oxygen saturation rhythms under normal and adaptive change conditionsMulti-functional laser non-invasive diagnostic systems, such as “LAKK-M”, allow the study of a number of microcirculatory parameters, including blood microcirculatory index (Im) (by laser Doppler flowmetry, LDF) and oxygen saturation (StO2) of skin tissue (by tissue reflectance oximetry, TRO). Such systems may provide significant information relevant to physiology and clinical medicine. The aim of this research was to use such a system to study the synchronization of microvascular blood flow and oxygen saturation rhythms under normal and adaptive change conditions [16]. Studies were conducted with 8 healthy volunteers – 3 females and 5 males of 21-49 years. Each volunteer was subjected to basic 3 minute tests. The volunteers were observed for between 1-4 months each, totalling 422 basic tests. Measurements were performed on the palmar surface of the right middle finger and the forearm medial surface. Wavelet analysis was used to study rhythmic oscillations in LDF- and TRO-data. Tissue oxygen consumption (from arterial and venal blood oxygen saturation and nutritive flux volume) was calculated for all volunteers during “adaptive changes” as (617±123 AU) and (102±38 AU) with and without arteriovenous anastomoses (AVAs) respectively. This demonstrates increased consumption compared to normal (495±170 AU) and (69±40 AU) with and without AVAs respectively. Data analysis demonstrated the emergence of resonance and synchronization of rhythms of microvascular blood flow and oxygen saturation as an adaptive change in myogenic oscillation (vasomotion) resulting from exercise and potentially from psychoemotional stress. Synchronization of myogenic rhythms during adaptive changes suggest increased oxygen consumption resulting from increased microvascular blood flow velocity. Fig. 6(a) The typical form of perfusion and tissue oxygen saturation graphs, measured using LDF and TRO, respectively and (b) wavelet analysis results following such basic tests, where δIm – amplitude of perfusion oscillations, δStO2 – amplitude of oxygen saturation oscillations. Furthermore, in (B), a line is used to represent the amplitude oscillation of microvascular blood flow (δIm)m=0.40 PU at a frequency of fm=0.084 Hz and tissue oxygen saturation (δStO2)m=0.27% at a frequency of fm=0.094 Hz for myogenic rhythms.  Fig. 7.(a) Perfusion and oxygen saturation graphs in cases of myogenic oscillation, represented on the Im-graph by a ↓, and (b) typical example of resonance and synchronised rhythms (fm=0.074 Hz) of microvascular blood flow (δIm)m=1.05 PU and oxygen saturation (δStO2)m=0.32% within the range of only myogenic oscillation (vasomotion) during adaptive hanges.  3.Analysis of Fluorescence Spectroscopy Parameters of Biological TissueFluorescence spectroscopy has recently become more common in clinical medicine. However, there are still many unresolved issues related to the methodology and implementation of instruments with this technology. In this study, we aimed to assess individual variability of fluorescence parameters of endogenous markers (NADH, FAD, etc.) measured by fluorescent spectroscopy (FS) in situ and to analyse the factors that lead to a significant scatter of results [17]. Most studied fluorophores have an acceptable scatter of values (mostly up to 30%) for diagnostic purposes. Here we provide evidence that the level of blood volume in tissue impacts FS data with a significant inverse co-relation. The distribution function of values of the fluorescence intensity and the coefficient of fluorescent contrast for most of the studied fluorophores and the redox ratio is a function of the normal distribution. The effects of various physiological (different content of skin melanin) and technical (characteristics of optical filters) factors on the measurement results were additionally studied. The data on the variability of the measurement results in FS should be considered when interpreting the diagnostic parameters, as well as when developing new algorithms for data processing and FS devices. Fig. 9.Examples of the fluorescence registering the third day (a) and eighth day (b). 1 – hematoma, 2 – intact tissue 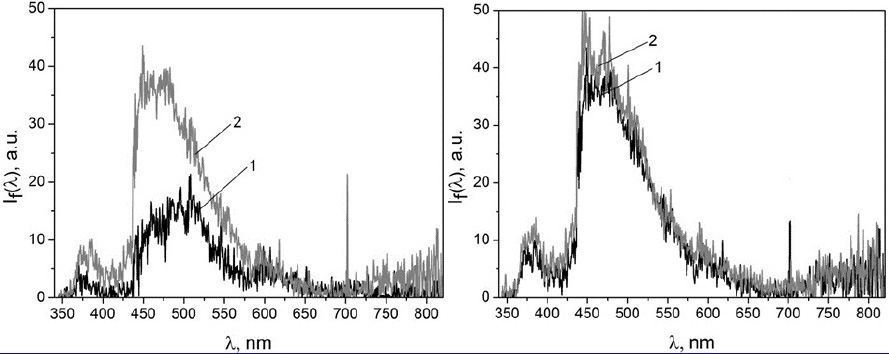 Influence of blood on backscattering and LFDThe foregoing results have clearly suggested that the intensity of the backscattered radiation is highly dependent on the blood supply to the skin which is likely to change during pathological processes in tissues, and thus provide additional diagnostic information [17]. To assess the nature of this effect a sample of 30 daily measurements in volunteer from the two study zones of the skin was collected to assess the intensity of backscattered radiation Ibs) relative to the volume of capillary blood supply to tissues Vb (TRO channel). As can be seen, the intensity of the backscattered radiation is inversely related to the blood supply to tissues for both zones of the skin. This is more clearly evident in the AVA region as would be expected (Fig. 11). Melanin absorptionAs is known, fluorescence is dependent on the pigmentation of the skin. Thus, this part of the research studied the effect of the skin melanin on the measured parameters in skin areas with and without AVAs as recorded on volunteers of different ethnic skin types includingities including Caucasian, Indian, Middle Eastern and African (with a range of melanin content approximately from 1.3% to 43%). It is generally known that the higher level of melanin in coloured skin has a significant impact on the ability of LFD to detect fluorophores of interest in LFD due to the increasing levels of absorbance by melanin across the visible spectrum. Nevertheless, MLNDS algorithms have not taken account of the fact that the absorbance varies significantly between for example the NAHD and FAD fluorescence lines. Separately research was carried out on a 25 year old female with a high level of melanin. Measurements were carried out, as previously, on two skin zones: a weakly pigmented finger pad and forearm area with a high content of melanin [17]. Fig. 12.The fluorescence spectra of skin with high levels of melanin, a – fingertip; b – forearm: the UV (1), green (2) and red (3) light excitation wavelengths.  The results clearly show the near 100% absorption of the visible spectrum in the pigmented skin area compared to the informative fluorescence spectra obtained in the un-pigmented zone. Nevertheless, a weakly informative fluorescence spectra was obtained in the pigmented zone using the red excitation laser as a result of the weaker melanin absorption in this region. Thus, it is possible to conclude that dermal spectroscopy can be potentially useful in the assessment of differences in melanin content of skin pigmentation changes in vivo and furthermore, that such data can potentially be of utility in calculating, using appropriate algorithms, the corrected relative amplitude of auto-fluorescence signals. Currently, the red spectral region is used in MLNDS for the detection of porphyrin fluorescence. The results above show that highly pigmented skin auto-fluorescence is highly dependent on the wavelength of excitation, which requires further detailed study. 4.In vivo noninvasive measurement of skin autofluorescence biomarkers relate to cardiovascular disease in miceThe formation of reactive oxygen species (ROS) is associated with cardiovascular disease (CVD). High dietary cholesterol can significantly alter the delicate balance between prooxidation and antioxidant defences leading to reactive oxygen species formation inthevasculature, without significant structural changes in tissue composition. We aimed to establish a methodology for the noninvasive assessment of skin fluorescent biomarkers in mice [18]. C57/black/6 wild-type (WT; n = 25) male mice were subdivided to receive normal rodent chow (n = 11) or a high cholesterol diet (2% cholesterol; n = 14) for 20 weeks. Skin autofluorescence measurements were made on the backs of anaesthetized (1.5–2% isoflurane in oxygen) mice. A laser probe was used to make simultaneous measurements of: collagen, elastin, nicotinamide adenine dinucleotide, pyridoxine, flavins, lipofuscin and ²-carotene. Results are expressed as group mean in arbitrary units (AU) ± standard error (SE). Hearts were excised and weighed (mg); cardiac hypertrophy was measured by ratio [heart weight (mg)/bodyweight (g) ± SE]. There were no significant differences between cholesterol- and chow-fed animals for collagen (34±5AUvs. chow 34±4AU, p=0.51) and elastin (66 ± 6AUvs.chow82±7AU, p=0.11). Significant differences were evident for nicotinamide adenine dinucleotide (92 ± 7 AU vs. chow 118 ± 7 AU, p = 0.01), pyridoxine (56±4 AU vs. chow 73±4AU, p=0.01), flavins (44 ± 3 AU vs. chow 57 ± 4 AU, p = 0.01), lipofuscin (35 ± 3AUvs.chow46±3AU, p=0.01) and β-carotene (19±2AU vs.chow25±2AU, p=0.01). Cholesterol-fed animals had significantly heavier hearts (7 ± 0.3 ratio vs. chow 5±0.1 ratio, p = 0.001). Cholesterol feeding induced cardiovascular disease as noted by cardiac hypertrophy in wild-type mice. A reduction was observed in pyridoxine, nicotinamide adenine dinucleotide, flavins, lipofuscin and β-carotene, which are established risk factors for cardiovascular disease. We report no significant changes in structural proteins collagen and elastin, suggesting no generalized tissue restructuring, which might otherwise explain the observed pathological differences. 5.Development of a bladder cross-section model for visualisation of optical propertiesThis study aims to create an optical cross-sectionional model of a bladder, capable of visually representing the passage of photons through the tissue layers. The absorption, transmission and reflectance data, along with the derived transmission coefficients (of scattering and absorption) were obtained from literature analysis and were used in the creation of a “generic” cross-section optical property model simulating the passage of thousands of photons through the tissue at different wavelengths. Fluorescence spectra of diagnostically relevant biomarkers excited by the UV and blue wavelengths were modelled on the basis of the Monte-Carlo method [19]. Further to this, fluorescence data gathered by the “LAKK-M” system from pig bladders was applied to the model for a specific representation of the photon passage through the tissues. The ultimate goal of this study is to employ this model to simulate the effects of different laser wavelength and energy inputs to bladder tissue and to determine the effectiveness of potential photonics based devices for the diagnosis of bladder pathologies. The model will aid in observing differences between healthy and pathological bladder tissues registered by photonics based devices. Fig. 14.(a) Side view of 3D model. Source, detector and the tissue layers are labelled. The lines indicate the passage of individual photons through the tissue. Darker lines indicate the photons which are heading directly towards the visible flat surface. (b) Full 3D view of model represented in figure 2a. Source and detector are represented by green circles.  The results of experimental urinary bladder fluorescence at 365 nm excitation were compared to a simulated cure produced using the 3D model. This simulation incorporates both NADH and collagen presence in the tissue. 6.Light-oxygen effectPhotodynamic therapy (PDT) is a technique developed to treat the ever-increasing global incidence of cancer. This technique utilises singlet oxygen (1O2) generation via a laser excited photosensitiser (PS) to kill cancer cells. However, prolonged sensitivity to intensive light (6–8 weeks for lung cancer), relatively low tissue penetration by activating light (630 nm up to 4 mm), and the cost of PS administration can limit progressive PDT applications. The development of quantum-dot laser diodes emitting in the highest absorption region (1268 nm) of triplet oxygen (3O2) presents the possibility of inducing apoptosis in tumour cells through direct 3O2 R 1O2 transition. Here we demonstrate that a single laser pulse triggers dose-dependent 1O2 generation in both normal keratinocytes and tumour cells and show that tumour cells yield the highest 1O2 far beyond the initial laser pulse exposure [20]. Fig. 16.1270 nm laser-induced (A) singlet oxygen generation in HaCaT (■), HeLa cancer (●) cells, and primary keratinocytes (▼) and (B) HeLa cell death rate (BI 2536 effectively kills cancer cells (positive control).  To dissect the cellular mechanism of direct ROS generation by 1268 nm laser irradiation we developed a kinetic model of a redox homeostasis alteration and oxidative stress under pulse laser exposure (Fig. 20). The main aim of the modelling is to elucidate a liminal nature of laser-induced oxidative stress followed by apoptosis signal [21]. Fig. 17.A model of cell redox homeostasis and its imbalance by laser induced ROS generation. (A) Scheme of cellular ROS production and scavenging. (B) Kinetics of ROS in normal and (C) cancerous cells. H2O2 (-); reduced PSH (-); primary ROS (1O2 and O2-), R1, (-); reduced thioredoxin peroxidase, Px (- -); sum of primary and secondary ROS, R2 (-); rate of 1O2 generation by 3 min laser pulse only (- -).  Based on our results, we can therefore conclude that our experimental and computational results explaining high ROS levels in cancer cells together with the fact that 1268 nm laser can induce cytotoxicity in HeLa cells may in near future propose a new therapeutic approach based on direct laser photoactivation of molecular oxygen in the tumour without the need for exogenous drugs gain opportunity to develop PS-free cancer phototherapy. 7.ConclusionBased on the presented results, we can therefore conclude that light and laser based diagnostics are already well established and routinely used in condition assessment, monitoring and diagnostics throughout the global healthcare sector. Continued advances in photonics and computing in the form of low costs, compact and high speed offer new prospects for biophotonics in the field of research and health. Multiple parameter measurements allow diagnosing the same tissue volume by any set of channels at one time. Progress in PS-free 1268 nm laser ablation therapy could be associated with reduced patient layoff time and lower cost (both associated with the application of photosensitizers), allowing an affordable and applicable diagnostic or therapeutic system for all. AcknowledgementsWe would like to thank Dr Victor Sidorov (SPE LAZMA Ltd.), Dr Andrey Dunaev from Oryol State University and all of our volunteers for their contribution to this research project. ReferencesJacques, S.,
“Optical properties of biological tissues: a review,”
Physics in Medicine and Biology, 58
(11), R37
–R61
(2013). Google Scholar
Krupatkin, A., & Sidorov, V., Laser Doppler flowmetry of blood microcirculation, Meditcina-Press, Moscow, RF
(2005). Google Scholar
Leahy, M., & Nilsson, G., Proc. SPIE 7563, Dynamics and Fluctuations in Biomedical Photonics VII, 75630E SPIE, San Francisco
(2010). Google Scholar
Lister, T., Wright, P., & Chappell, P.,
“Optical properties of human skin,”
Journal of Biomedical Optics, 17
(9), 0909011
–09090115
(2012). Google Scholar
Tuchin, V., Handbook of optical biomedical diagnostics, SPIE Press, Bellingham, Washington, USA
(2002). Google Scholar
Smirnova, O. D., Rogatkin, D., & Litvinova, K.,
“Collagen as in vivo quantitative fluorescent biomarkers of abnormal tissue changes,”
Journal of Innovative Optical Health Science, 5
(N 2), 1250010
(2012). Google Scholar
Rogatkin, D., & Lapaeva, L.,
“Prospects for development of non-invasive spectrophotometry medical diagnostics,”
Biomed. Engineering, 2.37
(4), 217
–222
(2003). Google Scholar
Ogawa, K. & Kobuke, Y., Two-Photon Photodynamic Therapy by Water-Soluble Self-Assembled Conjugated Porphyrins, BioMed Research International.2013). Google Scholar
Skuja L. and Guttler B.,
“Detection of interstitial oxygen molecules in SiO2 glass by direct photoexcitation of the infrared luminescence of singlet O2,”
Physical Review Letters, 77 2093
–2096
(1996). Google Scholar
Anquez, F., El Yazidi-Belkoura, I., Randoux, S., Suret, P., Courtade, E.,
“Cancerous cell death from sensitizer free photoactivation of singlet oxygen,”
Photochemistry and Photobiology, 88 167
–74
(2012). Google Scholar
Rogatkin, D., Sokolovski, S., Fedorova, K., Stewart, N., Sidorov, V., & Rafailov, E.,
“Basic principles of design and functioning of multifunctional laser diagnostic system for non-invasive medical spectrophotometry,”
Proceedings of SPIE, 7890
(78901H), Photonics West San-Francisco.2011). Google Scholar
Coca, D., Zheng, Y., Mayhew, J., & Billings, S.,
“Nonlinear system identification and analysis of complex dynamical behavior in reflected light measurements of vasomotion,”
International Journal of Bifurcation and Chaos, 10 461
–476
(2000). Google Scholar
Tyrrell, J., Thorn, C., Shore, A., Campbell, S., & Curnow, A.,
“Oxygen saturation and perfusion changes during dermatological methylaminolaevulinate photodynamic therapy,”
British Journal of Dermatology, 165 1323
–1331
(2011). Google Scholar
Thorn, C., Kyte, H., Slaff, D., & Shore, A.,
“An association between vasomotion and oxygen extraction,”
American Journal of Physiology-Heart and Circulatory Physiology, 301
(2), H442
–H449
(2011). Google Scholar
Koenig, K., & Schneckenburger, H.,
“Laser-Induced Autofluorescence for Medical Diagnosis,”
Journal of Fluorescence, 4
(1), 17
–21
(1994). Google Scholar
Dunaev, A., Sidorov, V., Krupatkin, A., Rafailov, I., Palmer, S., Stewart, N., Sokolovski, S., & Rafailov, E.,
“Investigating tissue respiration and skin microhaemocirculation under adaptive changes and the synchronization of blood flow and oxygen saturation rhythms,”
Physiological Measurement, 35 607
–621
(2014). Google Scholar
Dunaev, A., Dremin, V., Zherebtsov, E., Rafailov, I., Litvinova, K., Palmer, S., Stewart, N., Sokolovski, S., & Rafailov, E.,
“Individual variability analysis of fluorescence parameters measured in skin with different levels of nutritive blood flow,”
Medical Engineering and Physics, 37
(6), 574
–583
(2015). Google Scholar
Akbar, N., Sokolovski, S., Dunaev, A., Belch, J., Rafailov, E., & Khan, F.,
“In-vivo non-invasive measurement of skin autofluorescnce biomarkers relate to CVD in mice,”
Journal of Microscopy, 255
(1), 42
–48
(2014). Google Scholar
Rafailov, I., Palmer, S., Litvinova, K., Dremin, V., Dunaev, A., Nabi, G.,
“A novel excitation-emission wavelength model to facilitate the diagnosis of urinary bladder diseases,”
Proceeding of SPIE 9303, Photonic Therapeutics and Diagnostics XI, 93030W,
(2015). Google Scholar
Sokolovski, S., Zolotovskaya, S., Goltsov, A., Pourreyron, S., South, A., Rafailov, E.,
“Infrared laser pulse triggers increased singlet oxygen production in tumour cells,”
Scientific Reports, 12
(3),
(20133484). Google Scholar
Trachootham, D., Lu, W., Ogasawara, M.A., Nilsa, R.D., Huang, P.,
“Redox regulation of cell survival,”
Antioxid Redox Signal, 10 1343
–1374
(2008). Google Scholar
|